

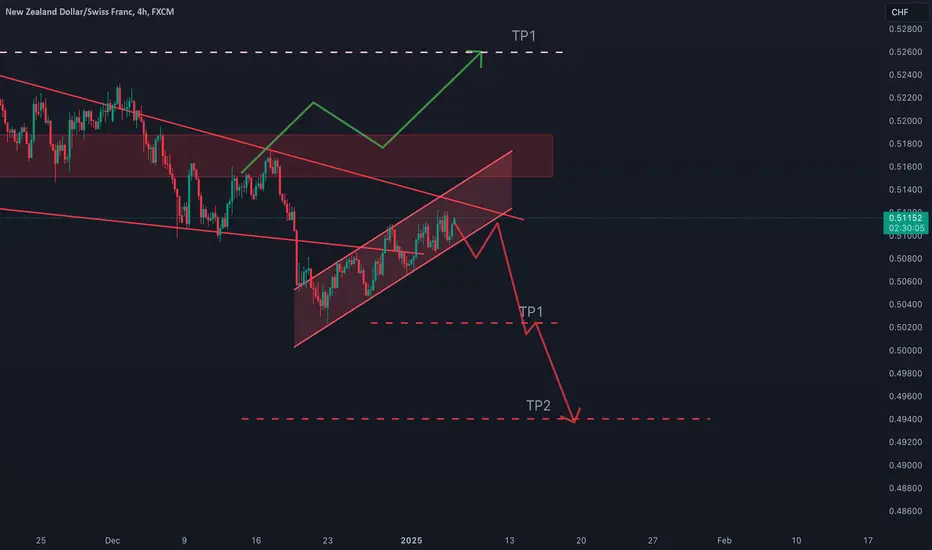
I had previously shared a chart for nzdchf. I was expecting the wedge to rise to 0.5250 if it tested the support zone after the upward breakout, but the price broke the wedge downwards instead of upward. Now it is inside the wedge again and has formed an inverted flag formation. With the downward breakout of the channel, the TP zones will be as in the chart.

כתב ויתור
המידע והפרסומים אינם מיועדים להיות, ואינם מהווים, ייעוץ או המלצה פיננסית, השקעתית, מסחרית או מכל סוג אחר המסופקת או מאושרת על ידי TradingView. קרא עוד ב־תנאי השימוש.
כתב ויתור
המידע והפרסומים אינם מיועדים להיות, ואינם מהווים, ייעוץ או המלצה פיננסית, השקעתית, מסחרית או מכל סוג אחר המסופקת או מאושרת על ידי TradingView. קרא עוד ב־תנאי השימוש.