
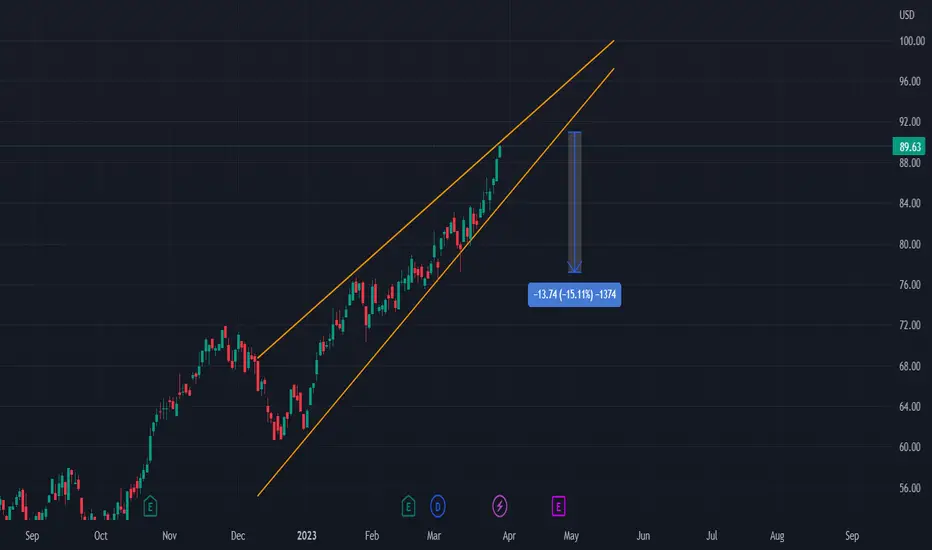
On the chart, we can see a rising wedge occurring.
OMAB is at its 52-week high, and this has been formed as a rising wedge.
We therefore expect it to have a drop to the downside.
Entry will be at the breakout of the wedge with a possible ROI of 15%
More details are shown on the chart.
OMAB is at its 52-week high, and this has been formed as a rising wedge.
We therefore expect it to have a drop to the downside.
Entry will be at the breakout of the wedge with a possible ROI of 15%
More details are shown on the chart.
עסקה סגורה: היעד הושג
Played out as expected. Closing here as target reached almost.הערה
Next Short may be entered on the retest of the upsloping resistance (previous support)הערה
have bounced
💥 Free signals and ideas ➡ t.me/vfinvestment
פרסומים קשורים
כתב ויתור
המידע והפרסומים אינם מיועדים להיות, ואינם מהווים, ייעוץ או המלצה פיננסית, השקעתית, מסחרית או מכל סוג אחר המסופקת או מאושרת על ידי TradingView. קרא עוד ב־תנאי השימוש.
💥 Free signals and ideas ➡ t.me/vfinvestment
פרסומים קשורים
כתב ויתור
המידע והפרסומים אינם מיועדים להיות, ואינם מהווים, ייעוץ או המלצה פיננסית, השקעתית, מסחרית או מכל סוג אחר המסופקת או מאושרת על ידי TradingView. קרא עוד ב־תנאי השימוש.