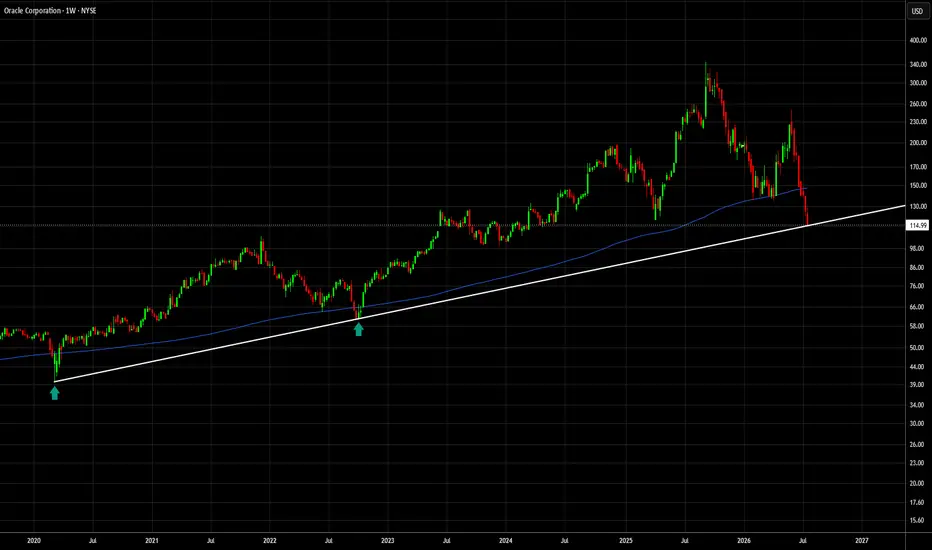
Looking at the weekly chart,  ORCL has just stopped right above a long-term trendline that has acted as major support twice before: during the March 2020 crash and again in October 2022. Both times, touching this trendline marked an important reversal point.
other thing that stands out is the 200-week moving average (blue line). Right now, the price is trading below it, but history suggests Oracle doesn't stay there for long.
Over the last 6 years, ORCL has broken below the 200-week moving average only three times:
1. March 2020 – Price stayed below it for just 3 weeks before reclaiming it.
2. September–October 2022 – Almost the exact same story, only 3 weeks below before breaking back above.
3. Current move – We're now seeing a very similar setup develop.
Zooming out even further, the picture becomes even more interesting.

In the last 15 years, Oracle has traded below the 200-week moving average only four times. Three of those were the periods mentioned above, while the fourth was back in 2016, when the stock stayed below the average for about 8 weeks before recovering (yellow circle).
Historically, ORCL simply doesn't like trading below its 200-week moving average for very long.
That's why I like this setup. We have two strong technical factors lining up:
1. A long-term trendline that has already proven itself as a major reversal area.
2. A stock that has repeatedly reclaimed its 200-week moving average after relatively short periods below it.
Of course, history doesn't guarantee the same outcome this time. The stock can always break down and continue lower.
But from a risk/reward perspective, I think this super attractive bounce setup. My risk is clearly defined, a break below the long-term trendline invalidates the idea while the upside potential is huge.
ORCL has just stopped right above a long-term trendline that has acted as major support twice before: during the March 2020 crash and again in October 2022. Both times, touching this trendline marked an important reversal point.other thing that stands out is the 200-week moving average (blue line). Right now, the price is trading below it, but history suggests Oracle doesn't stay there for long.
Over the last 6 years, ORCL has broken below the 200-week moving average only three times:
1. March 2020 – Price stayed below it for just 3 weeks before reclaiming it.
2. September–October 2022 – Almost the exact same story, only 3 weeks below before breaking back above.
3. Current move – We're now seeing a very similar setup develop.
Zooming out even further, the picture becomes even more interesting.
In the last 15 years, Oracle has traded below the 200-week moving average only four times. Three of those were the periods mentioned above, while the fourth was back in 2016, when the stock stayed below the average for about 8 weeks before recovering (yellow circle).
Historically, ORCL simply doesn't like trading below its 200-week moving average for very long.
That's why I like this setup. We have two strong technical factors lining up:
1. A long-term trendline that has already proven itself as a major reversal area.
2. A stock that has repeatedly reclaimed its 200-week moving average after relatively short periods below it.
Of course, history doesn't guarantee the same outcome this time. The stock can always break down and continue lower.
But from a risk/reward perspective, I think this super attractive bounce setup. My risk is clearly defined, a break below the long-term trendline invalidates the idea while the upside potential is huge.
עסקה פעילה
Bought some yesterday at around $119. The plan is to hold it as a swing trade. As mentioned before, stop-loss is below the long-term trendline that the price has bounced off.
כתב ויתור
המידע והפרסומים אינם מיועדים להיות, ואינם מהווים, ייעוץ או המלצה פיננסית, השקעתית, מסחרית או מכל סוג אחר המסופקת או מאושרת על ידי TradingView. קרא עוד ב־תנאי השימוש.
כתב ויתור
המידע והפרסומים אינם מיועדים להיות, ואינם מהווים, ייעוץ או המלצה פיננסית, השקעתית, מסחרית או מכל סוג אחר המסופקת או מאושרת על ידי TradingView. קרא עוד ב־תנאי השימוש.