
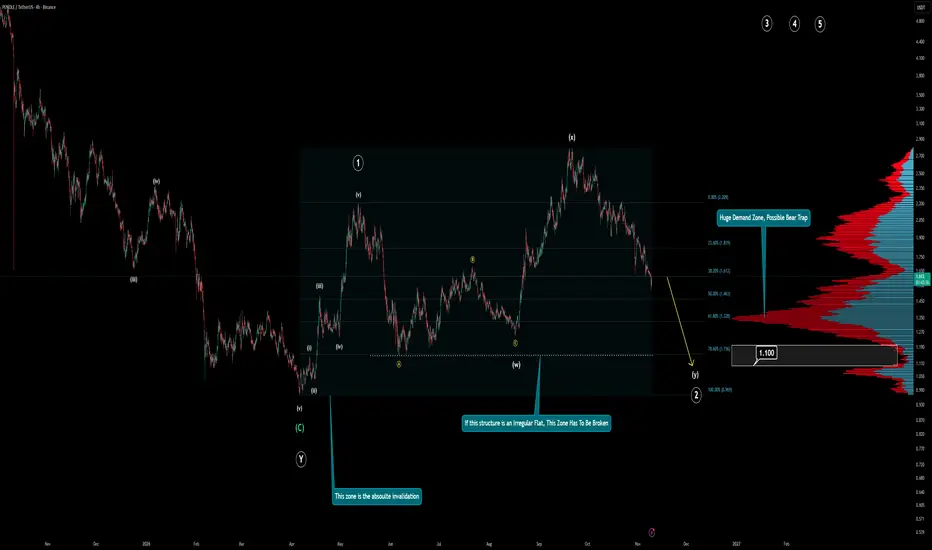
Here we are with a complex structure again.
First, check the high time frame:

In order to understand what's going on here, you must know advanced Elliott and NEoWave combinations. An experienced wave analyst would spend at least an hour on this chart while others would simply try to draw lines.
Let me explain what's going on here.
What you see is a large, complex correction type known as a double three. You can google it if you'd like to get more advanced knowledge. If you see this kind of structure on higher time frames like the daily and such, I'd simply advise moving away from that asset. Imagine the entire market as a video game; this is what I would call Level 10. If you still draw boxes and lines on your chart, this is not the place you should be.
First among the problems, we have a possible Triple Three danger. This is the biggest red flag you could ever see, but it's not 100% confirmed yet. What makes me think it could go even lower is the lower time frames.
Let's look at the main chart:
Generally, the entire crypto market is in a large wave 2 right now. Many assets like Chainlink, AVAX, Bitcoin, or ETH can easily be labeled by a rookie wave analyst. They are not really that hard to count, but this little guy has a problem. It does NOT have an impulse!
You see a five-wave upward move on the chart—that's only wave 1.
Also, you'll notice that there is an X on the chart, which means wave 1 is invalidated and larger wave 2 is an irregular complex correction type.
The first signal that proves it is the yellow ABC correction before that wave X.
Wave C wasn't able to break below A's low, which can only mean one thing: an EXPANDED FLAT is on the way.
After wave X formed, the price immediately reversed and is currently approaching a demand zone. You can see that demand zone by looking at the volume profile I drew on the chart.
That's where most traders will get hunted on both sides. Many will try to long and lose; others will try to short once their little boxes get broken.
The problematic part is, it HAS TO BE BROKEN.
In expanded flats, the last wave Y (or C) has to break below the previous wave X (or A). In this case, you'll have to look for other confluences.
Fib ratios: note the 78.6 level; that level is not there as a default just for fun. It will be your target. Combine it with the volume imbalance you see on the chart, and you'll have the ultimate target for the current move.
Invalidation and bigger risk:
If the price ever touches the low of this current larger move (the big Y-C low), check the higher time frame again and you'll understand that the structure is going to evolve into a Triple Three. In that case, you can expect many exchanges to delist this asset.
I do not provide financial advice. Thanks for reading.
First, check the high time frame:
In order to understand what's going on here, you must know advanced Elliott and NEoWave combinations. An experienced wave analyst would spend at least an hour on this chart while others would simply try to draw lines.
Let me explain what's going on here.
What you see is a large, complex correction type known as a double three. You can google it if you'd like to get more advanced knowledge. If you see this kind of structure on higher time frames like the daily and such, I'd simply advise moving away from that asset. Imagine the entire market as a video game; this is what I would call Level 10. If you still draw boxes and lines on your chart, this is not the place you should be.
First among the problems, we have a possible Triple Three danger. This is the biggest red flag you could ever see, but it's not 100% confirmed yet. What makes me think it could go even lower is the lower time frames.
Let's look at the main chart:
Generally, the entire crypto market is in a large wave 2 right now. Many assets like Chainlink, AVAX, Bitcoin, or ETH can easily be labeled by a rookie wave analyst. They are not really that hard to count, but this little guy has a problem. It does NOT have an impulse!
You see a five-wave upward move on the chart—that's only wave 1.
Also, you'll notice that there is an X on the chart, which means wave 1 is invalidated and larger wave 2 is an irregular complex correction type.
The first signal that proves it is the yellow ABC correction before that wave X.
Wave C wasn't able to break below A's low, which can only mean one thing: an EXPANDED FLAT is on the way.
After wave X formed, the price immediately reversed and is currently approaching a demand zone. You can see that demand zone by looking at the volume profile I drew on the chart.
That's where most traders will get hunted on both sides. Many will try to long and lose; others will try to short once their little boxes get broken.
The problematic part is, it HAS TO BE BROKEN.
In expanded flats, the last wave Y (or C) has to break below the previous wave X (or A). In this case, you'll have to look for other confluences.
Fib ratios: note the 78.6 level; that level is not there as a default just for fun. It will be your target. Combine it with the volume imbalance you see on the chart, and you'll have the ultimate target for the current move.
Invalidation and bigger risk:
If the price ever touches the low of this current larger move (the big Y-C low), check the higher time frame again and you'll understand that the structure is going to evolve into a Triple Three. In that case, you can expect many exchanges to delist this asset.
I do not provide financial advice. Thanks for reading.

כתב ויתור
המידע והפרסומים אינם מיועדים להיות, ואינם מהווים, ייעוץ או המלצה פיננסית, השקעתית, מסחרית או מכל סוג אחר המסופקת או מאושרת על ידי TradingView. קרא עוד ב־תנאי השימוש.
כתב ויתור
המידע והפרסומים אינם מיועדים להיות, ואינם מהווים, ייעוץ או המלצה פיננסית, השקעתית, מסחרית או מכל סוג אחר המסופקת או מאושרת על ידי TradingView. קרא עוד ב־תנאי השימוש.