PFIE Analysis
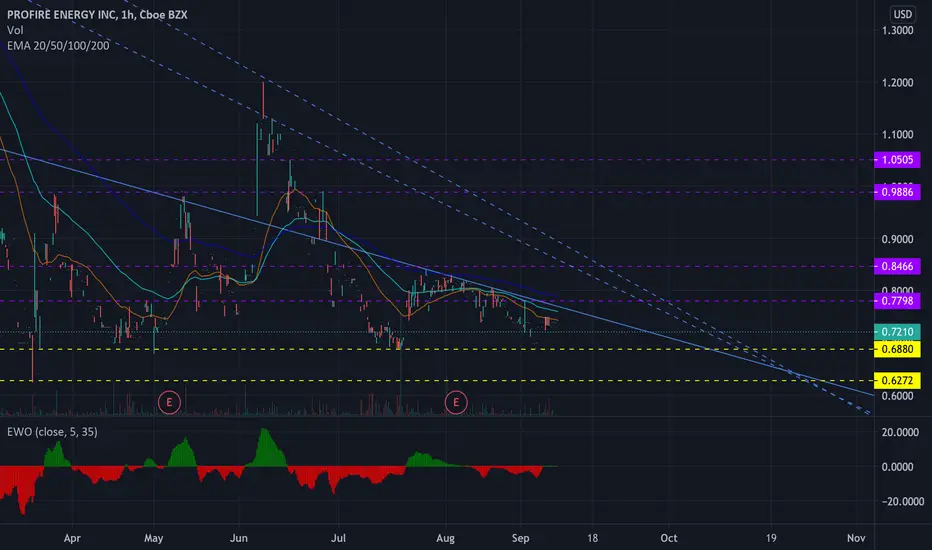
Recently, PFIE has been trading under its 20 EMA, indicating weakness. However, if PFIE can climb above .78, it could see higher highs, and a break above the current resistance represented by the full blue line could bring even higher levels towards to the purple resistance levels. However, PFIE has been holding .688 level very well -- a bounce off this level is imminent, but if it trend below this line, there's still a gap to fill down to .62.

כתב ויתור
המידע והפרסומים אינם מיועדים להיות, ואינם מהווים, ייעוץ או המלצה פיננסית, השקעתית, מסחרית או מכל סוג אחר המסופקת או מאושרת על ידי TradingView. קרא עוד ב־תנאי השימוש.
כתב ויתור
המידע והפרסומים אינם מיועדים להיות, ואינם מהווים, ייעוץ או המלצה פיננסית, השקעתית, מסחרית או מכל סוג אחר המסופקת או מאושרת על ידי TradingView. קרא עוד ב־תנאי השימוש.