
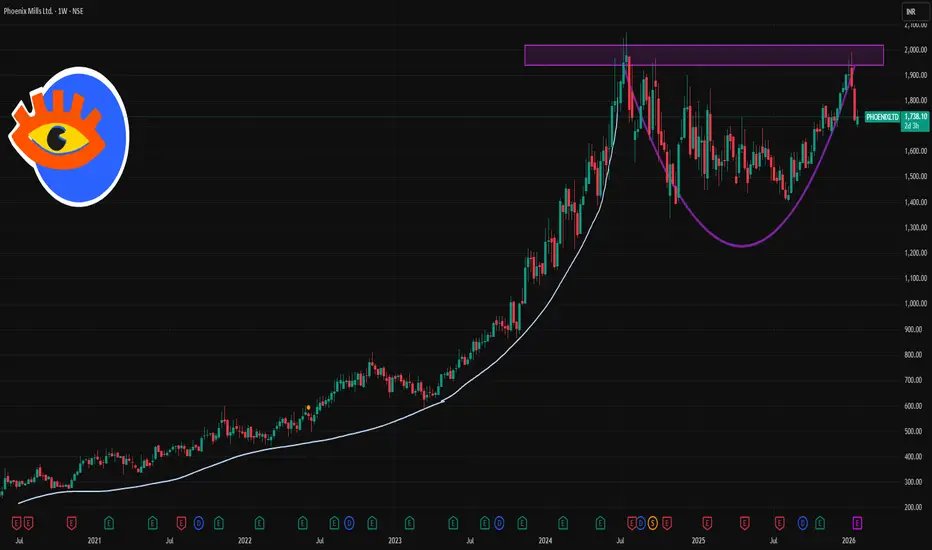
📌 Current weekly reference price: ~₹1,730–₹1,740 on NSE (updated latest).
📊 Weekly Pivot & Key Levels (Most Recent)
▶️ Weekly Pivot Point
Weekly Pivot (Standard): ₹1,768.93 (central reference for the week)
📈 Weekly Resistance Levels
(Upside levels where price may face selling pressure)
1. R1: ~₹1,818.67 – first major resistance zone this week
2. R2: ~₹1,910.83 – secondary resistance on extended upside
3. R3: ~₹1,960.57 – deep stretch resistance if bullish momentum builds
Interpretation:
A weekly close above ₹1,818–₹1,820 would suggest strength and bullish continuation into higher zones.
Strong upside momentum could target tier‑2 and tier‑3 resistance levels above ₹1,900.
📉 Weekly Support Levels
(Key downside levels where price may find buying interest)
1. S1: ~₹1,676.77 – immediate support if price dips from current levels
2. S2: ~₹1,627.03 – deeper zone of support below S1
3. S3: ~₹1,534.87 – medium‑term support zone, stronger base area
Interpretation:
If price confirms a break below weekly support ₹1,676–₹1,680, it increases the likelihood of further correction toward ₹1,627 and then ~₹1,535.
📌 Summary — Weekly Price Action Framework
Bullish Scenario (weekly view):
Price sustains above pivot ~₹1,768–₹1,770
Breaks ₹1,818–₹1,820 weekly resistance
➡️ Upside target zones: ₹1,910 → ₹1,960+
Bearish/Neutral Scenario (weekly view):
Weekly close below ₹1,676–₹1,680 support
➡️ Downside zones: ₹1,627 → ₹1,535
📊 Weekly Pivot & Key Levels (Most Recent)
▶️ Weekly Pivot Point
Weekly Pivot (Standard): ₹1,768.93 (central reference for the week)
📈 Weekly Resistance Levels
(Upside levels where price may face selling pressure)
1. R1: ~₹1,818.67 – first major resistance zone this week
2. R2: ~₹1,910.83 – secondary resistance on extended upside
3. R3: ~₹1,960.57 – deep stretch resistance if bullish momentum builds
Interpretation:
A weekly close above ₹1,818–₹1,820 would suggest strength and bullish continuation into higher zones.
Strong upside momentum could target tier‑2 and tier‑3 resistance levels above ₹1,900.
📉 Weekly Support Levels
(Key downside levels where price may find buying interest)
1. S1: ~₹1,676.77 – immediate support if price dips from current levels
2. S2: ~₹1,627.03 – deeper zone of support below S1
3. S3: ~₹1,534.87 – medium‑term support zone, stronger base area
Interpretation:
If price confirms a break below weekly support ₹1,676–₹1,680, it increases the likelihood of further correction toward ₹1,627 and then ~₹1,535.
📌 Summary — Weekly Price Action Framework
Bullish Scenario (weekly view):
Price sustains above pivot ~₹1,768–₹1,770
Breaks ₹1,818–₹1,820 weekly resistance
➡️ Upside target zones: ₹1,910 → ₹1,960+
Bearish/Neutral Scenario (weekly view):
Weekly close below ₹1,676–₹1,680 support
➡️ Downside zones: ₹1,627 → ₹1,535

Contact Knowledgehub for a detailed consultation: Dm on WhatsApp: [wa.link/a2o0kz]-
Phone No: [+91 93102 26243]-
Email: [tradingviewknowledgehub@gmail.com]---
-- Let’s achieve success together!
Phone No: [+91 93102 26243]-
Email: [tradingviewknowledgehub@gmail.com]---
-- Let’s achieve success together!
פרסומים קשורים
כתב ויתור
המידע והפרסומים אינם מיועדים להיות, ואינם מהווים, ייעוץ או המלצה פיננסית, השקעתית, מסחרית או מכל סוג אחר המסופקת או מאושרת על ידי TradingView. קרא עוד ב־תנאי השימוש.
Contact Knowledgehub for a detailed consultation: Dm on WhatsApp: [wa.link/a2o0kz]-
Phone No: [+91 93102 26243]-
Email: [tradingviewknowledgehub@gmail.com]---
-- Let’s achieve success together!
Phone No: [+91 93102 26243]-
Email: [tradingviewknowledgehub@gmail.com]---
-- Let’s achieve success together!
פרסומים קשורים
כתב ויתור
המידע והפרסומים אינם מיועדים להיות, ואינם מהווים, ייעוץ או המלצה פיננסית, השקעתית, מסחרית או מכל סוג אחר המסופקת או מאושרת על ידי TradingView. קרא עוד ב־תנאי השימוש.