
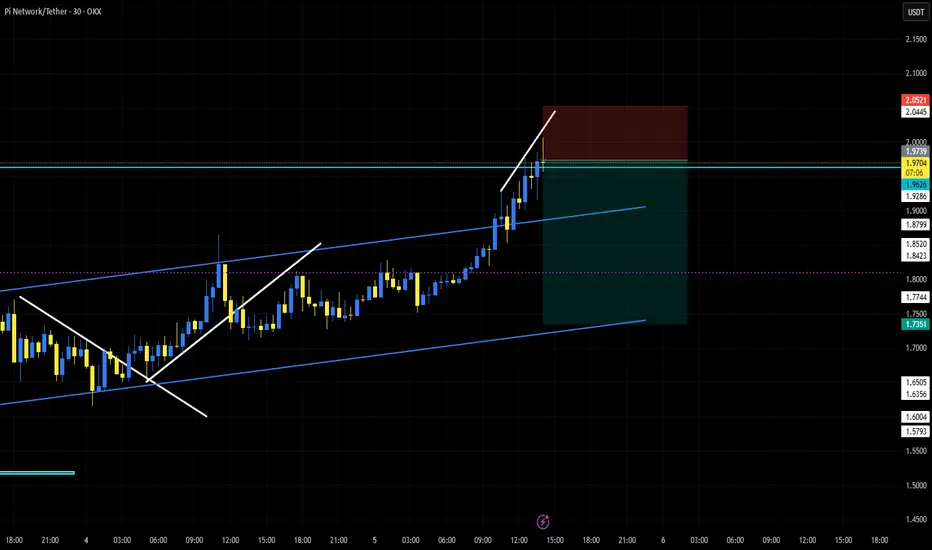
**PI/USDT – 30-Minute Chart Analysis**
The price is moving within an ascending channel and has recently reached the **1.9730 - 2.0445** resistance zone. A rising wedge pattern has formed at the top of this trend, which could indicate weakening bullish momentum.
If the price reacts negatively to this level, a correction towards the **1.8500 - 1.8200** range is possible. Conversely, if the resistance is broken, the price could move towards **2.1000**.
The price is moving within an ascending channel and has recently reached the **1.9730 - 2.0445** resistance zone. A rising wedge pattern has formed at the top of this trend, which could indicate weakening bullish momentum.
If the price reacts negatively to this level, a correction towards the **1.8500 - 1.8200** range is possible. Conversely, if the resistance is broken, the price could move towards **2.1000**.
עסקה פעילה
Close at TP1
כתב ויתור
המידע והפרסומים אינם מיועדים להיות, ואינם מהווים, ייעוץ או המלצה פיננסית, השקעתית, מסחרית או מכל סוג אחר המסופקת או מאושרת על ידי TradingView. קרא עוד ב־תנאי השימוש.
כתב ויתור
המידע והפרסומים אינם מיועדים להיות, ואינם מהווים, ייעוץ או המלצה פיננסית, השקעתית, מסחרית או מכל סוג אחר המסופקת או מאושרת על ידי TradingView. קרא עוד ב־תנאי השימוש.