
hi traders
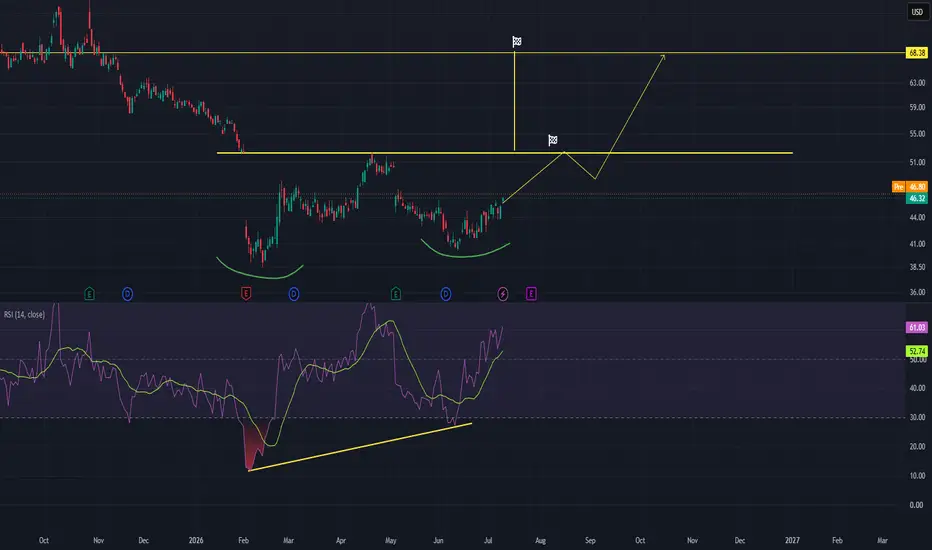
This technical analysis highlights a strong accumulation and potential trend reversal setup for PayPal (PYPL) on the Daily (1D) time frame. The price action indicates a bottoming structure backed by strong bullish momentum indicators.
1. Inverse Head and Shoulders / Double Bottom Accumulation
The price action has formed a clear bottoming structure, highlighted by the two green curved arcs beneath the lows in February and June.
This behaves effectively as a large Double Bottom pattern (or a complex bottoming accumulation), signaling a shift from a prolonged downtrend to an emerging uptrend.
The current price is steadily rising out of the second bottom, heading toward key horizontal overhead resistance levels.
2. Massive Bullish Divergence on Daily RSI
A major structural validation comes from the Relative Strength Index (RSI) at the bottom of the chart.
While the price action in June printed a low that was notably close to or slightly higher than the deep February low, the RSI printed a substantially higher low (indicated by the yellow upward-sloping trendline).
This strong bullish divergence highlights that selling pressure has severely dried up, and buyers are aggressively absorbing shares on dips.
3. Price Path & Targets
The chart projects a multi-stage bullish pathway over the coming months:
Target 1 (Neckline Resistance): ~$52.00 – $53.00
The first major flag icon marks the horizontal yellow resistance line at roughly $52.50. The projected yellow path shows the price rallying directly to this neckline, followed by a brief corrective retest/consolidation phase.
Target 2 (Macro Target): $68.38
Once the neckline is successfully broken and flipped to support, the ultimate target for this reversal structure sits at the higher yellow horizontal level at $68.38 (marked by the top flag icon). This represents the next major structural liquidity zone from late previous year.
This technical analysis highlights a strong accumulation and potential trend reversal setup for PayPal (PYPL) on the Daily (1D) time frame. The price action indicates a bottoming structure backed by strong bullish momentum indicators.
1. Inverse Head and Shoulders / Double Bottom Accumulation
The price action has formed a clear bottoming structure, highlighted by the two green curved arcs beneath the lows in February and June.
This behaves effectively as a large Double Bottom pattern (or a complex bottoming accumulation), signaling a shift from a prolonged downtrend to an emerging uptrend.
The current price is steadily rising out of the second bottom, heading toward key horizontal overhead resistance levels.
2. Massive Bullish Divergence on Daily RSI
A major structural validation comes from the Relative Strength Index (RSI) at the bottom of the chart.
While the price action in June printed a low that was notably close to or slightly higher than the deep February low, the RSI printed a substantially higher low (indicated by the yellow upward-sloping trendline).
This strong bullish divergence highlights that selling pressure has severely dried up, and buyers are aggressively absorbing shares on dips.
3. Price Path & Targets
The chart projects a multi-stage bullish pathway over the coming months:
Target 1 (Neckline Resistance): ~$52.00 – $53.00
The first major flag icon marks the horizontal yellow resistance line at roughly $52.50. The projected yellow path shows the price rallying directly to this neckline, followed by a brief corrective retest/consolidation phase.
Target 2 (Macro Target): $68.38
Once the neckline is successfully broken and flipped to support, the ultimate target for this reversal structure sits at the higher yellow horizontal level at $68.38 (marked by the top flag icon). This represents the next major structural liquidity zone from late previous year.

💥 Free signals and ideas ➡ t.me/vfinvestment
כתב ויתור
המידע והפרסומים אינם מיועדים להיות, ואינם מהווים, ייעוץ או המלצה פיננסית, השקעתית, מסחרית או מכל סוג אחר המסופקת או מאושרת על ידי TradingView. קרא עוד ב־תנאי השימוש.
💥 Free signals and ideas ➡ t.me/vfinvestment
כתב ויתור
המידע והפרסומים אינם מיועדים להיות, ואינם מהווים, ייעוץ או המלצה פיננסית, השקעתית, מסחרית או מכל סוג אחר המסופקת או מאושרת על ידי TradingView. קרא עוד ב־תנאי השימוש.