
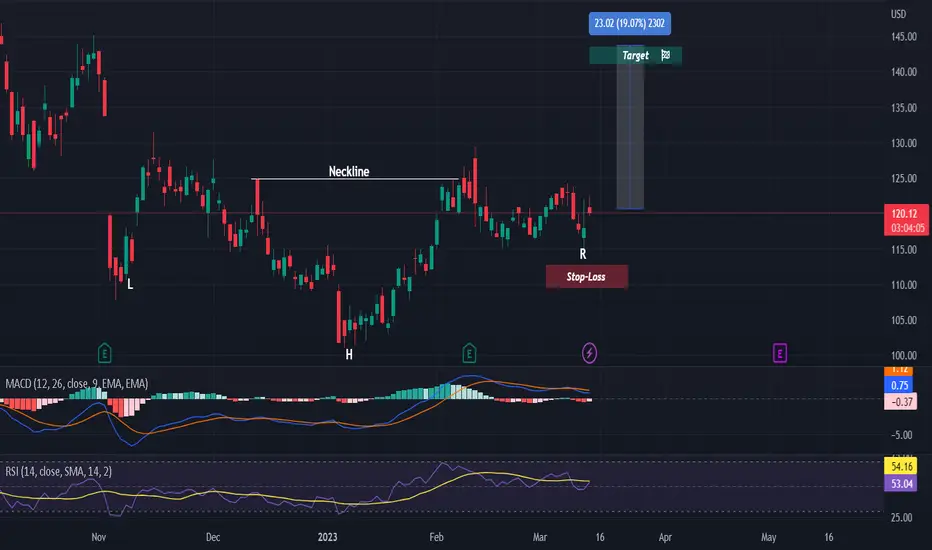
On the chart, we can see an inverse head and shoulders, which is a strong bullish pattern.
Both MACD and RSI are indicating bullish crossings.
We will now wait for a breakout of the neckline, to take our entry.
More details are shown on the chart.
Good luck! 🚀
Both MACD and RSI are indicating bullish crossings.
We will now wait for a breakout of the neckline, to take our entry.
More details are shown on the chart.
Good luck! 🚀

💥 Free signals and ideas ➡ t.me/vfinvestment
פרסומים קשורים
כתב ויתור
המידע והפרסומים אינם מיועדים להיות, ואינם מהווים, ייעוץ או המלצה פיננסית, השקעתית, מסחרית או מכל סוג אחר המסופקת או מאושרת על ידי TradingView. קרא עוד ב־תנאי השימוש.
💥 Free signals and ideas ➡ t.me/vfinvestment
פרסומים קשורים
כתב ויתור
המידע והפרסומים אינם מיועדים להיות, ואינם מהווים, ייעוץ או המלצה פיננסית, השקעתית, מסחרית או מכל סוג אחר המסופקת או מאושרת על ידי TradingView. קרא עוד ב־תנאי השימוש.