
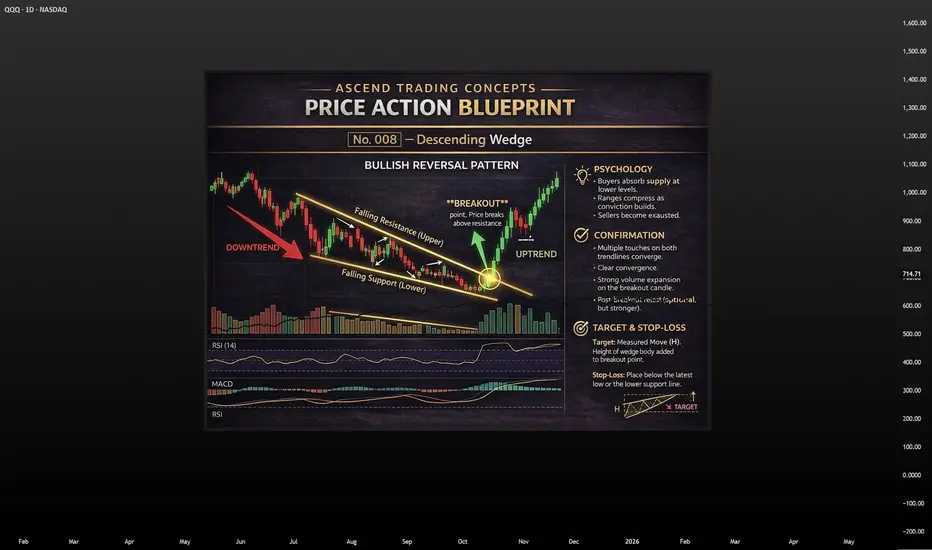
A descending wedge is a bullish pattern that often forms while price is still drifting lower, which is why many traders misread it at first.
At a glance, the chart looks bearish. Price is falling, momentum looks weak, and the market seems heavy. But in a true descending wedge, both trendlines slope downward and converge, meaning the range is tightening as price falls.
That tightening matters.
👉 Sellers are still pushing price lower
👉 Each push lower is becoming less effective
👉 The downtrend is losing force
That is what gives the pattern its bullish potential.
🧠 What the Pattern Looks Like
A descending wedge is built from:
• a falling upper resistance line
• a falling lower support line
• repeated price swings inside a narrowing range
The two lines are not parallel. If they were, the pattern would look more like a channel. A wedge is different because the compression itself is part of the message.
Price is still moving lower, but the market is no longer expanding downward with the same strength. That often signals seller exhaustion.
🔍 The Psychology Behind It
This pattern reflects a battle between weakening sellers and increasingly patient buyers.
As the wedge forms:
• weak holders keep selling
• bears remain active
• buyers begin absorbing at lower prices
• volume often starts to dry up
Each decline creates fear. Each bounce creates hope. Over time, fewer sellers remain aggressive enough to keep driving the market lower with authority.
That is why the descending wedge can become a bullish reversal setup. The market is still moving lower, but the quality of the selling pressure is deteriorating.
✅ What Confirms the Pattern
The pattern is not confirmed just because you can draw the lines.
A strong descending wedge usually includes:
• multiple touches on both trendlines
• clear convergence of the lines
• reduced activity during formation
• a decisive break above the upper resistance line
• ideally, stronger participation on the breakout
That breakout is the real signal. Until resistance breaks, the wedge is only a possibility.
📈 What Happens After Breakout
The breakout does not always lead to an immediate straight-up move.
Sometimes price breaks out and runs. Other times it breaks out, pauses, or lightly pulls back before continuing higher. That does not automatically mean failure.
A modest pullback after breakout can simply be the market testing whether the breakout level will now hold as support. The real warning sign is when price falls back inside the wedge.
🎯 Targets and Stops
A common way to estimate an upside target is to measure the height of the wedge at its widest point and project that distance upward from the breakout area.
Stops should also make sense structurally, such as:
• below the most recent important low
• below the lower wedge boundary
• below the post-breakout swing low
The goal is to define risk logically if the breakout fails.
🚨 Common Mistakes
Traders often misuse this pattern by:
❌ assuming every falling pattern is bearish
❌ entering before breakout confirmation
❌ ignoring whether the lines truly converge
❌ panicking over a normal post-breakout pullback
❌ confusing a retracement with a failed breakout
🔑 Bottom Line
📍 A descending wedge is a bullish reversal pattern
📍 It shows a falling market with weakening selling pressure
📍 The real signal is the break above resistance
📍 Small pullbacks after breakout can be normal
📍 A move back into the wedge is the real warning sign
📈 The message is simple:
price may still be falling, but sellers are running out of power — and once resistance breaks, the reversal can begin.
At a glance, the chart looks bearish. Price is falling, momentum looks weak, and the market seems heavy. But in a true descending wedge, both trendlines slope downward and converge, meaning the range is tightening as price falls.
That tightening matters.
👉 Sellers are still pushing price lower
👉 Each push lower is becoming less effective
👉 The downtrend is losing force
That is what gives the pattern its bullish potential.
🧠 What the Pattern Looks Like
A descending wedge is built from:
• a falling upper resistance line
• a falling lower support line
• repeated price swings inside a narrowing range
The two lines are not parallel. If they were, the pattern would look more like a channel. A wedge is different because the compression itself is part of the message.
Price is still moving lower, but the market is no longer expanding downward with the same strength. That often signals seller exhaustion.
🔍 The Psychology Behind It
This pattern reflects a battle between weakening sellers and increasingly patient buyers.
As the wedge forms:
• weak holders keep selling
• bears remain active
• buyers begin absorbing at lower prices
• volume often starts to dry up
Each decline creates fear. Each bounce creates hope. Over time, fewer sellers remain aggressive enough to keep driving the market lower with authority.
That is why the descending wedge can become a bullish reversal setup. The market is still moving lower, but the quality of the selling pressure is deteriorating.
✅ What Confirms the Pattern
The pattern is not confirmed just because you can draw the lines.
A strong descending wedge usually includes:
• multiple touches on both trendlines
• clear convergence of the lines
• reduced activity during formation
• a decisive break above the upper resistance line
• ideally, stronger participation on the breakout
That breakout is the real signal. Until resistance breaks, the wedge is only a possibility.
📈 What Happens After Breakout
The breakout does not always lead to an immediate straight-up move.
Sometimes price breaks out and runs. Other times it breaks out, pauses, or lightly pulls back before continuing higher. That does not automatically mean failure.
A modest pullback after breakout can simply be the market testing whether the breakout level will now hold as support. The real warning sign is when price falls back inside the wedge.
🎯 Targets and Stops
A common way to estimate an upside target is to measure the height of the wedge at its widest point and project that distance upward from the breakout area.
Stops should also make sense structurally, such as:
• below the most recent important low
• below the lower wedge boundary
• below the post-breakout swing low
The goal is to define risk logically if the breakout fails.
🚨 Common Mistakes
Traders often misuse this pattern by:
❌ assuming every falling pattern is bearish
❌ entering before breakout confirmation
❌ ignoring whether the lines truly converge
❌ panicking over a normal post-breakout pullback
❌ confusing a retracement with a failed breakout
🔑 Bottom Line
📍 A descending wedge is a bullish reversal pattern
📍 It shows a falling market with weakening selling pressure
📍 The real signal is the break above resistance
📍 Small pullbacks after breakout can be normal
📍 A move back into the wedge is the real warning sign
📈 The message is simple:
price may still be falling, but sellers are running out of power — and once resistance breaks, the reversal can begin.

Visit AscendTradingConcepts.com for extensive FREE trading education and access to our Premium Exclusive Indicators.
Visit in your browser (Edge/Chrome/Safari) — TradingView's built-in browser does not support our site's latest security protocols.
Visit in your browser (Edge/Chrome/Safari) — TradingView's built-in browser does not support our site's latest security protocols.
כתב ויתור
המידע והפרסומים אינם מיועדים להיות, ואינם מהווים, ייעוץ או המלצה פיננסית, השקעתית, מסחרית או מכל סוג אחר המסופקת או מאושרת על ידי TradingView. קרא עוד ב־תנאי השימוש.
Visit AscendTradingConcepts.com for extensive FREE trading education and access to our Premium Exclusive Indicators.
Visit in your browser (Edge/Chrome/Safari) — TradingView's built-in browser does not support our site's latest security protocols.
Visit in your browser (Edge/Chrome/Safari) — TradingView's built-in browser does not support our site's latest security protocols.
כתב ויתור
המידע והפרסומים אינם מיועדים להיות, ואינם מהווים, ייעוץ או המלצה פיננסית, השקעתית, מסחרית או מכל סוג אחר המסופקת או מאושרת על ידי TradingView. קרא עוד ב־תנאי השימוש.