
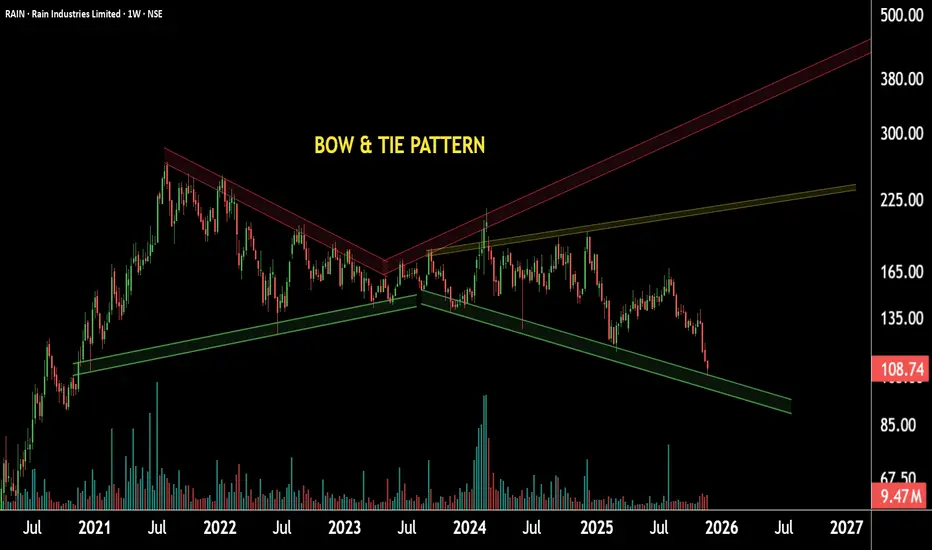
This is the weekly timeframe chart of Rain Industries.
The stock is forming a Bow & Tie pattern on the long-term timeframe and is currently trading near the key support zone around ₹100.
The major support level near ₹80, based on the EMA, remains crucial.
If this support holds, the stock has the potential to move toward new highs in the coming sessions.
Thank You !!
The stock is forming a Bow & Tie pattern on the long-term timeframe and is currently trading near the key support zone around ₹100.
The major support level near ₹80, based on the EMA, remains crucial.
If this support holds, the stock has the potential to move toward new highs in the coming sessions.
Thank You !!

@RahulSarawagi
Connect us at optionlab.co.in/
Connect us at optionlab.co.in/
כתב ויתור
המידע והפרסומים אינם מיועדים להיות, ואינם מהווים, ייעוץ או המלצה פיננסית, השקעתית, מסחרית או מכל סוג אחר המסופקת או מאושרת על ידי TradingView. קרא עוד ב־תנאי השימוש.
@RahulSarawagi
Connect us at optionlab.co.in/
Connect us at optionlab.co.in/
כתב ויתור
המידע והפרסומים אינם מיועדים להיות, ואינם מהווים, ייעוץ או המלצה פיננסית, השקעתית, מסחרית או מכל סוג אחר המסופקת או מאושרת על ידי TradingView. קרא עוד ב־תנאי השימוש.