
RAVEUSDT | Post-Crash Accumulation → Base Formation → Parabolic
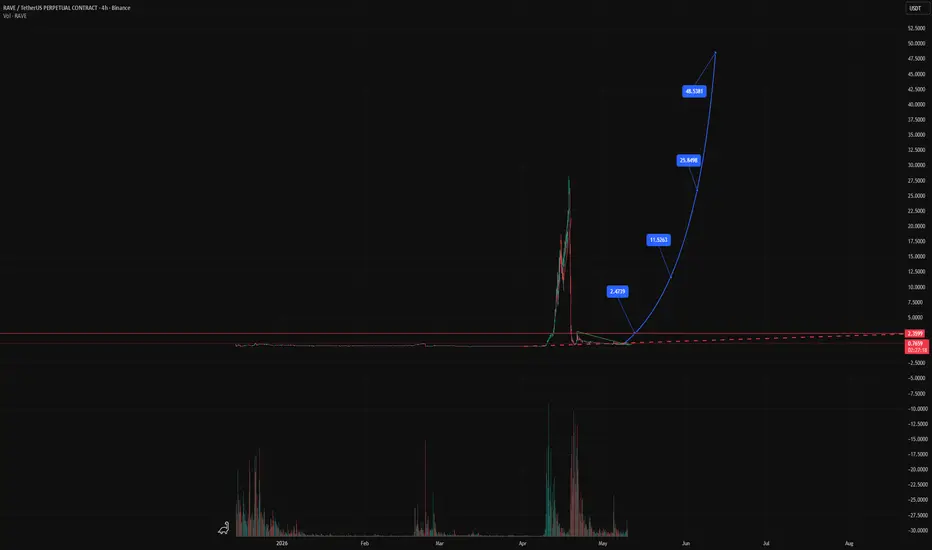
RAVEUSDT | Post-Crash Accumulation → Base Formation → Parabolic Expansion Setup 🚀
RAVEUSDT has undergone a classic blow-off top followed by a full market reset, with price collapsing sharply after an aggressive rally. Since then, price has entered a prolonged low-volatility accumulation phase near the base.
━━━━━━━━━━━━━━━
📊 Market Structure Breakdown
• Initial phase: Parabolic expansion → distribution → sharp liquidation
• Current phase: Compression at lows with reduced volatility
• Price action now shows signs of base stabilization
The long sideways structure suggests:
→ Weak hands fully shaken out
→ Supply absorbed over time
→ Potential accumulation by stronger participants
━━━━━━━━━━━━━━━
💡 Key Structural Insight
After extreme moves, markets typically cycle through:
Expansion → Distribution → Collapse → Accumulation → Re-Expansion
RAVE appears to be transitioning from:
Accumulation → Early Expansion Phase
━━━━━━━━━━━━━━━
🚀 Projected Expansion Path
The marked projection outlines a high-volatility expansion scenario:
🔹 Phase 1: Breakout from base (~2.4 region)
🔹 Phase 2: Acceleration toward mid-range (~11.5)
🔹 Phase 3: Momentum continuation (~25.8)
🔹 Phase 4: Potential parabolic move (~48+)
These levels represent liquidity magnets where price may react during expansion.
━━━━━━━━━━━━━━━
⚠️ Risk & Invalidation
• Failure to hold above base support
• Continued low-volume chop without breakout
• Rejection from initial breakout level
This would indicate prolonged accumulation or further downside.
━━━━━━━━━━━━━━━
🧠 Key Insight
Low-volatility bases after extreme crashes often precede high-impact expansion moves.
The longer the compression, the stronger the potential breakout.
━━━━━━━━━━━━━━━
📌 Conclusion
RAVEUSDT is currently positioned at a critical inflection point.
A confirmed breakout from this base could trigger a [b>multi-stage expansion toward higher liquidity zones.
Patience is key — the move, if triggered, can be explosive.
RAVEUSDT has undergone a classic blow-off top followed by a full market reset, with price collapsing sharply after an aggressive rally. Since then, price has entered a prolonged low-volatility accumulation phase near the base.
━━━━━━━━━━━━━━━
📊 Market Structure Breakdown
• Initial phase: Parabolic expansion → distribution → sharp liquidation
• Current phase: Compression at lows with reduced volatility
• Price action now shows signs of base stabilization
The long sideways structure suggests:
→ Weak hands fully shaken out
→ Supply absorbed over time
→ Potential accumulation by stronger participants
━━━━━━━━━━━━━━━
💡 Key Structural Insight
After extreme moves, markets typically cycle through:
Expansion → Distribution → Collapse → Accumulation → Re-Expansion
RAVE appears to be transitioning from:
Accumulation → Early Expansion Phase
━━━━━━━━━━━━━━━
🚀 Projected Expansion Path
The marked projection outlines a high-volatility expansion scenario:
🔹 Phase 1: Breakout from base (~2.4 region)
🔹 Phase 2: Acceleration toward mid-range (~11.5)
🔹 Phase 3: Momentum continuation (~25.8)
🔹 Phase 4: Potential parabolic move (~48+)
These levels represent liquidity magnets where price may react during expansion.
━━━━━━━━━━━━━━━
⚠️ Risk & Invalidation
• Failure to hold above base support
• Continued low-volume chop without breakout
• Rejection from initial breakout level
This would indicate prolonged accumulation or further downside.
━━━━━━━━━━━━━━━
🧠 Key Insight
Low-volatility bases after extreme crashes often precede high-impact expansion moves.
The longer the compression, the stronger the potential breakout.
━━━━━━━━━━━━━━━
📌 Conclusion
RAVEUSDT is currently positioned at a critical inflection point.
A confirmed breakout from this base could trigger a [b>multi-stage expansion toward higher liquidity zones.
Patience is key — the move, if triggered, can be explosive.

כתב ויתור
המידע והפרסומים אינם מיועדים להיות, ואינם מהווים, ייעוץ או המלצה פיננסית, השקעתית, מסחרית או מכל סוג אחר המסופקת או מאושרת על ידי TradingView. קרא עוד ב־תנאי השימוש.
כתב ויתור
המידע והפרסומים אינם מיועדים להיות, ואינם מהווים, ייעוץ או המלצה פיננסית, השקעתית, מסחרית או מכל סוג אחר המסופקת או מאושרת על ידי TradingView. קרא עוד ב־תנאי השימוש.