
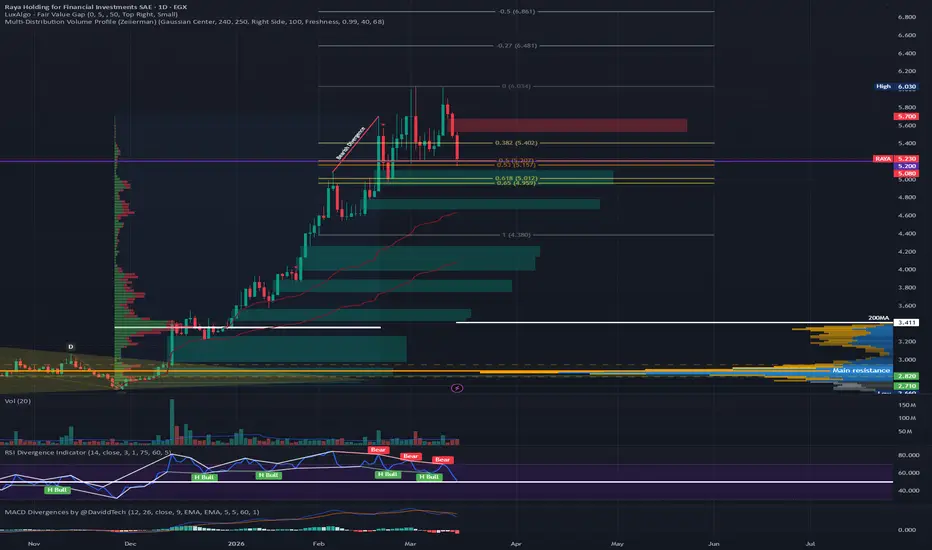
Raya is starting to show signs of a pullback after its recent move 📉.
The stock closed above an important support level at 5.2, which is currently a key level to watch.
⚠️ If 5.2 breaks, it could confirm a double-top pattern, potentially pushing the price toward the following support levels:
• 4.7
• 4.3
The stock is also very stretched and trading far above the 200 MA and main support levels, which increases the risk of a strong correction if new liquidity does not enter the stock. 📊
⚠️ Due to the current market volatility, I don’t recommend entering at this stage.
👉 If you like my analysis, please follow and boost 🚀📊
The stock closed above an important support level at 5.2, which is currently a key level to watch.
⚠️ If 5.2 breaks, it could confirm a double-top pattern, potentially pushing the price toward the following support levels:
• 4.7
• 4.3
The stock is also very stretched and trading far above the 200 MA and main support levels, which increases the risk of a strong correction if new liquidity does not enter the stock. 📊
⚠️ Due to the current market volatility, I don’t recommend entering at this stage.
👉 If you like my analysis, please follow and boost 🚀📊

פרסומים קשורים
כתב ויתור
המידע והפרסומים אינם מיועדים להיות, ואינם מהווים, ייעוץ או המלצה פיננסית, השקעתית, מסחרית או מכל סוג אחר המסופקת או מאושרת על ידי TradingView. קרא עוד ב־תנאי השימוש.
כתב ויתור
המידע והפרסומים אינם מיועדים להיות, ואינם מהווים, ייעוץ או המלצה פיננסית, השקעתית, מסחרית או מכל סוג אחר המסופקת או מאושרת על ידי TradingView. קרא עוד ב־תנאי השימוש.