
The chart is self-explanatory and is shared for educational purposes.
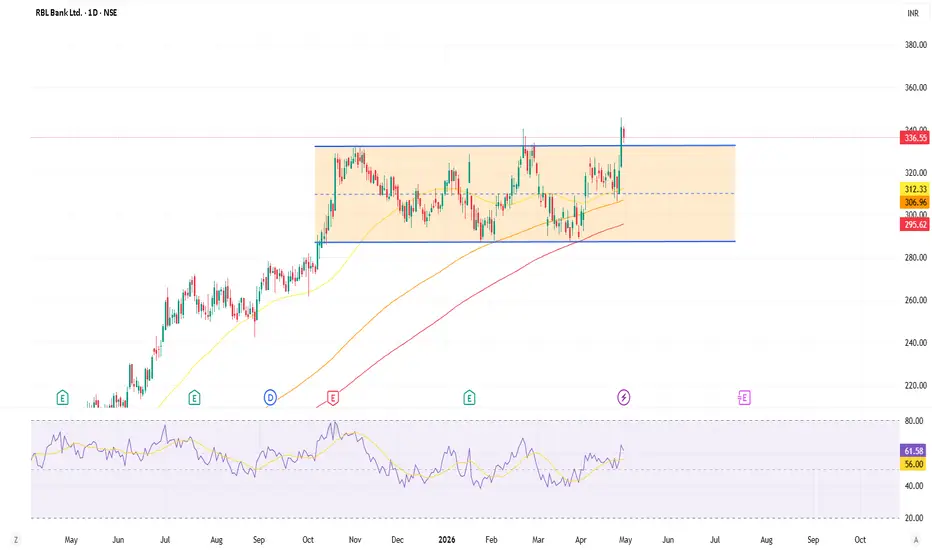
RBLBANK has recently delivered a strong breakout from a long-term consolidation range (rectangle pattern). The stock is consistently trading above its key moving averages, with the 50, 150, and 200-period lines showing a positive slope.
Following the breakout above the resistance zone, the price action suggests that previous resistance is now acting as a floor. With the RSI maintaining positive momentum, the upward trend appears likely to continue as long as it holds above the breakout level.
RBLBANK has recently delivered a strong breakout from a long-term consolidation range (rectangle pattern). The stock is consistently trading above its key moving averages, with the 50, 150, and 200-period lines showing a positive slope.
Following the breakout above the resistance zone, the price action suggests that previous resistance is now acting as a floor. With the RSI maintaining positive momentum, the upward trend appears likely to continue as long as it holds above the breakout level.

כתב ויתור
המידע והפרסומים אינם מיועדים להיות, ואינם מהווים, ייעוץ או המלצה פיננסית, השקעתית, מסחרית או מכל סוג אחר המסופקת או מאושרת על ידי TradingView. קרא עוד ב־תנאי השימוש.
כתב ויתור
המידע והפרסומים אינם מיועדים להיות, ואינם מהווים, ייעוץ או המלצה פיננסית, השקעתית, מסחרית או מכל סוג אחר המסופקת או מאושרת על ידי TradingView. קרא עוד ב־תנאי השימוש.