
Hi traders,
Weekly Trading Strategy
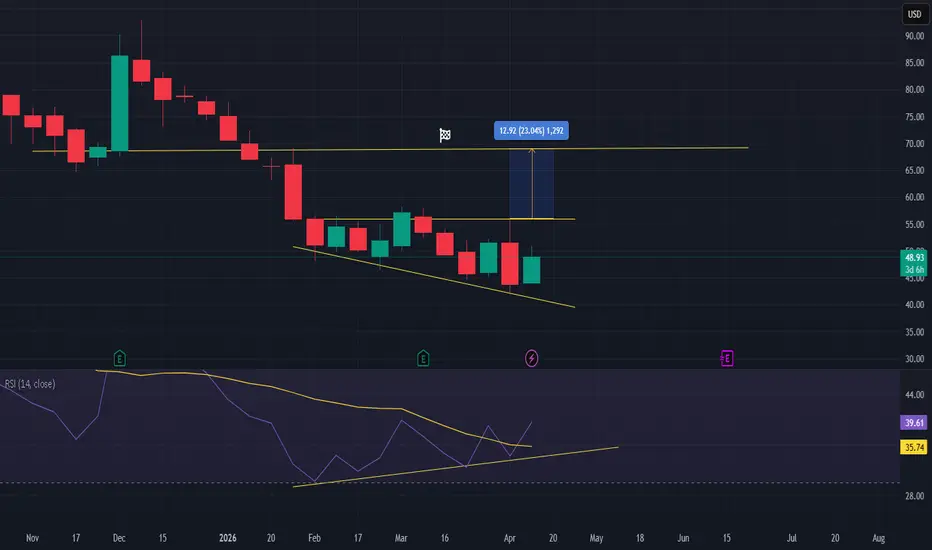
The stock is showing a potential double bottom or rounding bottom formation on the weekly chart after a period of decline.
Key Technical Observations:
• Support Level: Holding strong around the 27.50 - 28.00 zone.
• Resistance/Breakout Point: The immediate horizontal resistance is at 36.00. A weekly close above this level could signal a trend reversal.
• RSI: The RSI is currently around 48, moving upwards from oversold territory, suggesting gaining bullish momentum.
• Moving Averages: Price is currently testing the 20-week EMA.
Idea: Accumulate near support at 28.00 or wait for a confirmed weekly breakout above 36.00 for a long-term swing trade. Target the prior highs near 40.00+.
Weekly Trading Strategy
The stock is showing a potential double bottom or rounding bottom formation on the weekly chart after a period of decline.
Key Technical Observations:
• Support Level: Holding strong around the 27.50 - 28.00 zone.
• Resistance/Breakout Point: The immediate horizontal resistance is at 36.00. A weekly close above this level could signal a trend reversal.
• RSI: The RSI is currently around 48, moving upwards from oversold territory, suggesting gaining bullish momentum.
• Moving Averages: Price is currently testing the 20-week EMA.
Idea: Accumulate near support at 28.00 or wait for a confirmed weekly breakout above 36.00 for a long-term swing trade. Target the prior highs near 40.00+.
עסקה סגורה: היעד הושג
target reached
💥 Free signals and ideas ➡ t.me/vfinvestment
כתב ויתור
המידע והפרסומים אינם מיועדים להיות, ואינם מהווים, ייעוץ או המלצה פיננסית, השקעתית, מסחרית או מכל סוג אחר המסופקת או מאושרת על ידי TradingView. קרא עוד ב־תנאי השימוש.
💥 Free signals and ideas ➡ t.me/vfinvestment
כתב ויתור
המידע והפרסומים אינם מיועדים להיות, ואינם מהווים, ייעוץ או המלצה פיננסית, השקעתית, מסחרית או מכל סוג אחר המסופקת או מאושרת על ידי TradingView. קרא עוד ב־תנאי השימוש.