
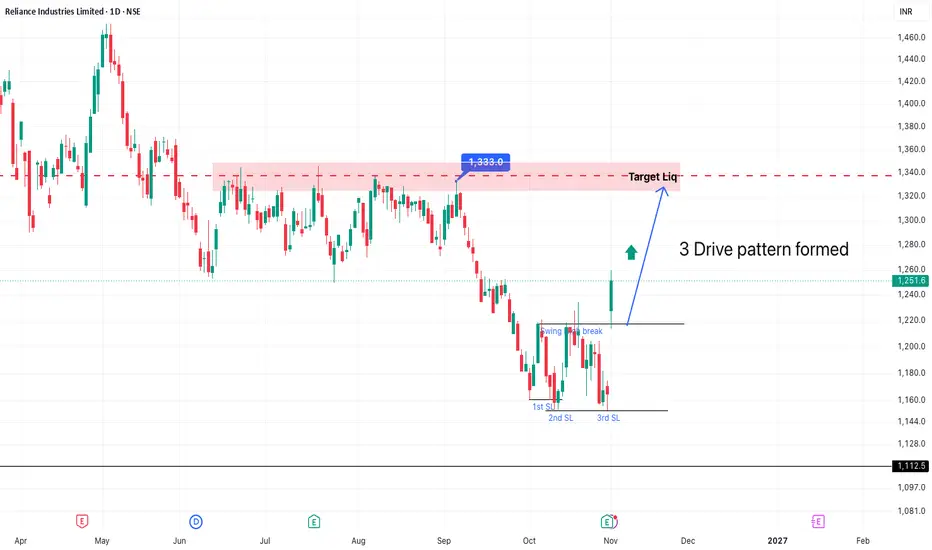
3-Drive Pattern — Harmonic Trading Strategy
The 3-Drive Pattern is an advanced harmonic reversal pattern used in technical analysis to identify potential trend exhaustion and reversal zones. It is based on Fibonacci ratios, symmetry, and three consecutive drives toward a final Potential Reversal Zone (PRZ).


10
1. Basic Structure
A Bullish 3-Drive looks like:
O → X → A → B → C → D
Price makes three progressively structured drives downward, with Fibonacci extensions defining each drive.
The trader looks for the completion of Drive 3 at D and then waits for evidence of a bullish reversal.
A Bearish 3-Drive is the exact opposite: three structured drives upward, ending at D, where a bearish reversal may occur.
2. Fibonacci Rules
The classic 3-Drive pattern uses approximately:
Leg Fibonacci relationship
Drive 1 → Retracement 61.8%
Drive 2 1.272 extension
Next retracement 61.8%
Drive 3 1.272 extension
The key idea is symmetry.
For example:
Bullish 3-Drive
* XA → AB retracement ≈ 61.8%
* AB → BC extension ≈ 1.272
* BC → CD retracement ≈ 61.8%
* CD → final extension ≈ 1.272
The exact ratios can vary slightly depending on the methodology being used, so don't treat one Fibonacci number as an absolute rule.
3. Bullish 3-Drive
The bullish pattern forms after a sequence of declining drives.
B
/ \
/ \
X / \ C
\ / \
A \
\ D
\ /
\_____/
Potential
Reversal Zone
Trading idea
At D, sellers may be exhausted.
Instead of immediately buying, look for confirmation such as:
* Liquidity sweep
* Rejection candle
* Market Structure Shift (MSS)
* Break of a short-term swing high
* Bullish Order Block
* Bullish Fair Value Gap
* Strong displacement candle
Entry
A conservative approach:
D → confirmation → retracement → Long
rather than simply buying at D.
Stop Loss
Typically:
Below D / below the liquidity sweep
Targets
Possible targets:
TP1: Previous minor swing TP2: C TP3: B TP4: Major opposing liquidity
4. Bearish 3-Drive
The bearish version is the mirror image.
Price makes three progressively structured upward drives.
At the completion of Drive 3:
D = Potential Reversal Zone
Then look for bearish confirmation.
Confirmation
Possible signals:
* Buy-side liquidity sweep
* Bearish displacement
* Market Structure Shift
* Bearish Order Block
* Bearish FVG
* Rejection from the PRZ
Trade
D → bearish confirmation → retracement → Short
Stop:
Above D / above liquidity sweep
Targets:
C → B → A / opposing liquidity
5. The Most Important Concept: Symmetry
The 3-Drive pattern isn't simply:
"I see three moves, therefore it's a 3-Drive."
You want proportionality.
Think of it as:
Drive 1 ≈ Drive 2 ≈ Drive 3
and:
Retracement 1 ≈ Retracement 2
The more closely the Fibonacci relationships and time/price symmetry align, the stronger the pattern becomes.
6. 3-Drive + Smart Money Concepts
Since you're studying SMC, this is where the pattern becomes much more powerful.
Instead of trading the harmonic pattern alone:
Step 1 — Identify the 3 Drives
Find:
Drive 1 → Retracement → Drive 2 → Retracement → Drive 3
Step 2 — Calculate Fibonacci
Check approximately:
61.8% retracement
and
1.272 extension
Step 3 — Locate Liquidity
Ask:
What liquidity is sitting beyond D?
For example:
* Equal highs
* Equal lows
* Previous swing high
* Previous swing low
* Buy-side liquidity
* Sell-side liquidity
Step 4 — Wait for the Sweep
The ideal setup may look like:
3-Drive completion + Liquidity Sweep
Step 5 — Look for MSS
After the sweep, wait for:
Displacement → MSS/BOS → Retracement
Step 6 — Enter
The retracement can provide an entry around:
* Order Block
* FVG
* 50% equilibrium
* Fibonacci retracement area
7. Example — Bearish Setup
Imagine NIFTY is moving upward:
D
/|
/ |
/ |
B──── |
/ |
/ |
A─── |
\ |
\ |
C────────────
At D:
1. Price reaches the 1.272 extension.
2. D is near previous highs.
3. Buy-side liquidity exists above the high.
4. Price sweeps the high.
5. Strong bearish displacement appears.
6. Market Structure Shift occurs.
7. Price retraces into a bearish FVG/Order Block.
8. Short entry.
9. Stop above D.
10. Target opposing sell-side liquidity.
This is considerably stronger than simply saying:
"3-Drive completed, so I'll short."
8. 3-Drive vs Gartley/Bat/Butterfly
The 3-Drive is different from many other harmonic patterns.
Pattern Main characteristic
Gartley Complex 5-point structure
Bat Deep XA retracement
Butterfly Extreme XA extension
Crab Very deep extension
3-Drive Three symmetrical impulse drives
The 3-Drive is particularly interesting for traders who like identifying exhaustion after repeated directional expansion.
9. High-Probability Checklist
Before taking a trade, check:
☐ Three clearly identifiable drives ☐ Fibonacci ratios approximately align ☐ Drives show reasonable symmetry ☐ Price reaches a meaningful PRZ ☐ Liquidity exists around/above/below D ☐ Liquidity sweep occurs ☐ Market Structure Shift occurs ☐ Displacement confirms the reversal ☐ Entry comes from OB/FVG/retracement ☐ Stop is beyond structural invalidation ☐ Risk/reward is acceptable
Best setup
3-Drive + Fibonacci PRZ + Liquidity Sweep + MSS + FVG/OB
The 3-Drive Pattern is an advanced harmonic reversal pattern used in technical analysis to identify potential trend exhaustion and reversal zones. It is based on Fibonacci ratios, symmetry, and three consecutive drives toward a final Potential Reversal Zone (PRZ).


10
1. Basic Structure
A Bullish 3-Drive looks like:
O → X → A → B → C → D
Price makes three progressively structured drives downward, with Fibonacci extensions defining each drive.
The trader looks for the completion of Drive 3 at D and then waits for evidence of a bullish reversal.
A Bearish 3-Drive is the exact opposite: three structured drives upward, ending at D, where a bearish reversal may occur.
2. Fibonacci Rules
The classic 3-Drive pattern uses approximately:
Leg Fibonacci relationship
Drive 1 → Retracement 61.8%
Drive 2 1.272 extension
Next retracement 61.8%
Drive 3 1.272 extension
The key idea is symmetry.
For example:
Bullish 3-Drive
* XA → AB retracement ≈ 61.8%
* AB → BC extension ≈ 1.272
* BC → CD retracement ≈ 61.8%
* CD → final extension ≈ 1.272
The exact ratios can vary slightly depending on the methodology being used, so don't treat one Fibonacci number as an absolute rule.
3. Bullish 3-Drive
The bullish pattern forms after a sequence of declining drives.
B
/ \
/ \
X / \ C
\ / \
A \
\ D
\ /
\_____/
Potential
Reversal Zone
Trading idea
At D, sellers may be exhausted.
Instead of immediately buying, look for confirmation such as:
* Liquidity sweep
* Rejection candle
* Market Structure Shift (MSS)
* Break of a short-term swing high
* Bullish Order Block
* Bullish Fair Value Gap
* Strong displacement candle
Entry
A conservative approach:
D → confirmation → retracement → Long
rather than simply buying at D.
Stop Loss
Typically:
Below D / below the liquidity sweep
Targets
Possible targets:
TP1: Previous minor swing TP2: C TP3: B TP4: Major opposing liquidity
4. Bearish 3-Drive
The bearish version is the mirror image.
Price makes three progressively structured upward drives.
At the completion of Drive 3:
D = Potential Reversal Zone
Then look for bearish confirmation.
Confirmation
Possible signals:
* Buy-side liquidity sweep
* Bearish displacement
* Market Structure Shift
* Bearish Order Block
* Bearish FVG
* Rejection from the PRZ
Trade
D → bearish confirmation → retracement → Short
Stop:
Above D / above liquidity sweep
Targets:
C → B → A / opposing liquidity
5. The Most Important Concept: Symmetry
The 3-Drive pattern isn't simply:
"I see three moves, therefore it's a 3-Drive."
You want proportionality.
Think of it as:
Drive 1 ≈ Drive 2 ≈ Drive 3
and:
Retracement 1 ≈ Retracement 2
The more closely the Fibonacci relationships and time/price symmetry align, the stronger the pattern becomes.
6. 3-Drive + Smart Money Concepts
Since you're studying SMC, this is where the pattern becomes much more powerful.
Instead of trading the harmonic pattern alone:
Step 1 — Identify the 3 Drives
Find:
Drive 1 → Retracement → Drive 2 → Retracement → Drive 3
Step 2 — Calculate Fibonacci
Check approximately:
61.8% retracement
and
1.272 extension
Step 3 — Locate Liquidity
Ask:
What liquidity is sitting beyond D?
For example:
* Equal highs
* Equal lows
* Previous swing high
* Previous swing low
* Buy-side liquidity
* Sell-side liquidity
Step 4 — Wait for the Sweep
The ideal setup may look like:
3-Drive completion + Liquidity Sweep
Step 5 — Look for MSS
After the sweep, wait for:
Displacement → MSS/BOS → Retracement
Step 6 — Enter
The retracement can provide an entry around:
* Order Block
* FVG
* 50% equilibrium
* Fibonacci retracement area
7. Example — Bearish Setup
Imagine NIFTY is moving upward:
D
/|
/ |
/ |
B──── |
/ |
/ |
A─── |
\ |
\ |
C────────────
At D:
1. Price reaches the 1.272 extension.
2. D is near previous highs.
3. Buy-side liquidity exists above the high.
4. Price sweeps the high.
5. Strong bearish displacement appears.
6. Market Structure Shift occurs.
7. Price retraces into a bearish FVG/Order Block.
8. Short entry.
9. Stop above D.
10. Target opposing sell-side liquidity.
This is considerably stronger than simply saying:
"3-Drive completed, so I'll short."
8. 3-Drive vs Gartley/Bat/Butterfly
The 3-Drive is different from many other harmonic patterns.
Pattern Main characteristic
Gartley Complex 5-point structure
Bat Deep XA retracement
Butterfly Extreme XA extension
Crab Very deep extension
3-Drive Three symmetrical impulse drives
The 3-Drive is particularly interesting for traders who like identifying exhaustion after repeated directional expansion.
9. High-Probability Checklist
Before taking a trade, check:
☐ Three clearly identifiable drives ☐ Fibonacci ratios approximately align ☐ Drives show reasonable symmetry ☐ Price reaches a meaningful PRZ ☐ Liquidity exists around/above/below D ☐ Liquidity sweep occurs ☐ Market Structure Shift occurs ☐ Displacement confirms the reversal ☐ Entry comes from OB/FVG/retracement ☐ Stop is beyond structural invalidation ☐ Risk/reward is acceptable
Best setup
3-Drive + Fibonacci PRZ + Liquidity Sweep + MSS + FVG/OB
הערה
#Disclaimer: The information provided in this content is for educational and informational purposes only and should not be considered investment advice, financial advice, trading advice, or a recommendation to buy, sell, or hold any security, stock, derivative, cryptocurrency, or other financial instrument.Stock market investments are subject to market risks, including the possible loss of part or all of your invested capital. Past performance does not guarantee future results.
Any examples, charts, technical analysis, Smart Money Concepts (SMC), price-action strategies, market views, or trading setups discussed are provided solely for educational purposes. They are not guarantees of future market performance.

כתב ויתור
המידע והפרסומים אינם מיועדים להיות, ואינם מהווים, ייעוץ או המלצה פיננסית, השקעתית, מסחרית או מכל סוג אחר המסופקת או מאושרת על ידי TradingView. קרא עוד ב־תנאי השימוש.
כתב ויתור
המידע והפרסומים אינם מיועדים להיות, ואינם מהווים, ייעוץ או המלצה פיננסית, השקעתית, מסחרית או מכל סוג אחר המסופקת או מאושרת על ידי TradingView. קרא עוד ב־תנאי השימוש.