
Experimental analysis with the intention to follow back later on as I am still learning
I thought I'd share this as it seems interesting, given its low probability.
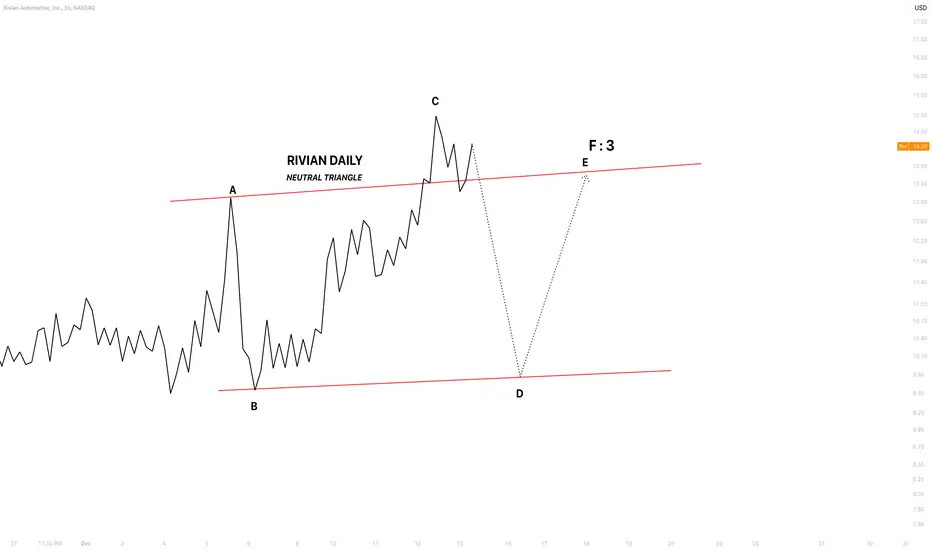
The lines represent a projected path and do not represent time
The pattern forms a neutral triangle.
Wave C is the largest, potentially 138% to 161.8% of wave A.
In this scenario, wave C concludes at 138%, provided my calculations are correct.
Any movement above wave C would invalidate this pattern.
I anticipate a significant sell-off to begin shortly for this to be accurate.
Let's see how this goes
I thought I'd share this as it seems interesting, given its low probability.
The lines represent a projected path and do not represent time
The pattern forms a neutral triangle.
Wave C is the largest, potentially 138% to 161.8% of wave A.
In this scenario, wave C concludes at 138%, provided my calculations are correct.
Any movement above wave C would invalidate this pattern.
I anticipate a significant sell-off to begin shortly for this to be accurate.
Let's see how this goes
הערה
It appears that the rally has concluded and wave C has come to an end.
כתב ויתור
המידע והפרסומים אינם מיועדים להיות, ואינם מהווים, ייעוץ או המלצה פיננסית, השקעתית, מסחרית או מכל סוג אחר המסופקת או מאושרת על ידי TradingView. קרא עוד ב־תנאי השימוש.
כתב ויתור
המידע והפרסומים אינם מיועדים להיות, ואינם מהווים, ייעוץ או המלצה פיננסית, השקעתית, מסחרית או מכל סוג אחר המסופקת או מאושרת על ידי TradingView. קרא עוד ב־תנאי השימוש.