
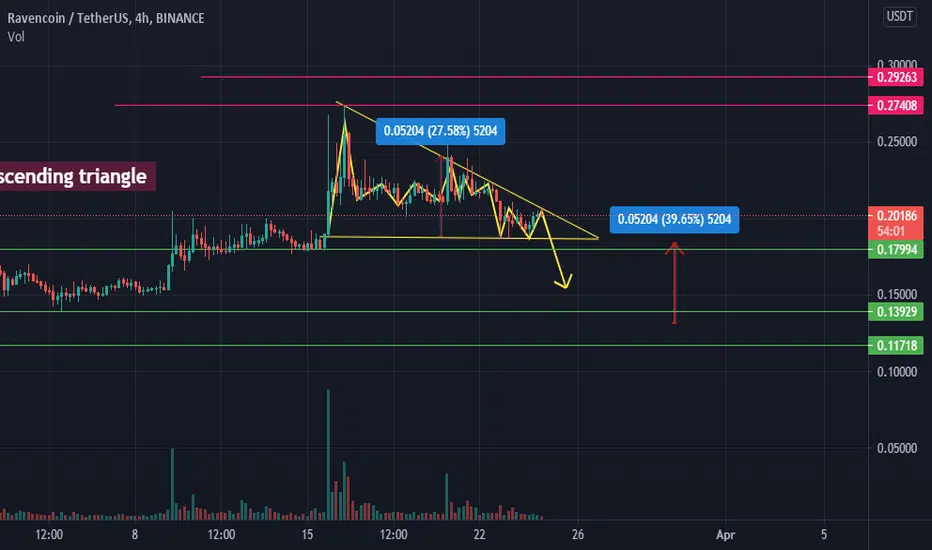
We can see a descending triangle on 4 hour chart of RVN/USDT (Binance).
DESCENDING TRIANGLE has bearish reversal interpretation.
If it breaks it support line it will breakdown to the marked point.
Red lines represents major resistances while green are showing major supports.
We can clearly see 2 valid taps on resistance line and support line inside the formed triangle.
Dial indicator showing ( Bought indicator ) means that the current volume is at sell signal.
DESCENDING TRIANGLE has bearish reversal interpretation.
If it breaks it support line it will breakdown to the marked point.
Red lines represents major resistances while green are showing major supports.
We can clearly see 2 valid taps on resistance line and support line inside the formed triangle.
Dial indicator showing ( Bought indicator ) means that the current volume is at sell signal.

כתב ויתור
המידע והפרסומים אינם מיועדים להיות, ואינם מהווים, ייעוץ או המלצה פיננסית, השקעתית, מסחרית או מכל סוג אחר המסופקת או מאושרת על ידי TradingView. קרא עוד ב־תנאי השימוש.
כתב ויתור
המידע והפרסומים אינם מיועדים להיות, ואינם מהווים, ייעוץ או המלצה פיננסית, השקעתית, מסחרית או מכל סוג אחר המסופקת או מאושרת על ידי TradingView. קרא עוד ב־תנאי השימוש.