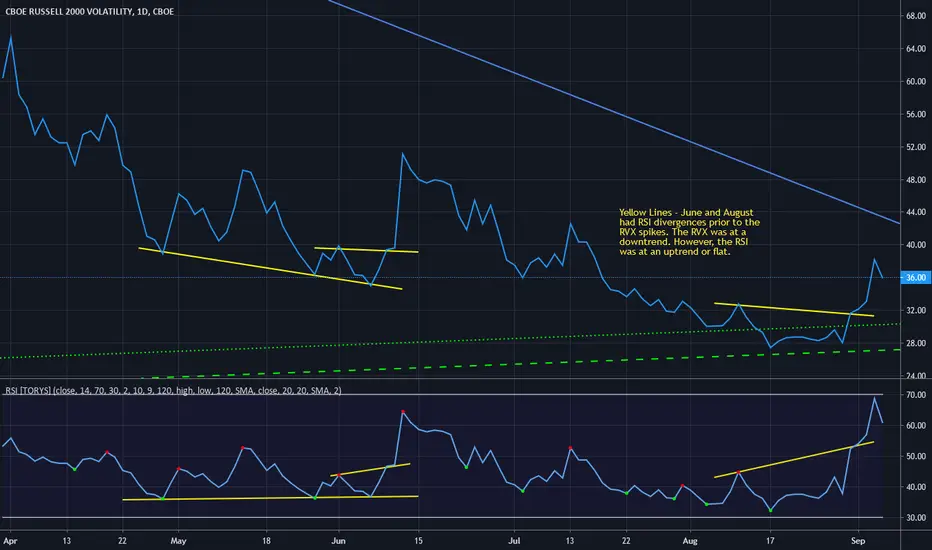
RVX at the daily view.
This is a project that my trading team and I are conducting. This is 4 of 9 charts (available on Trading View) that searches for clues for an imminent correction by using both June and September 2020 cases. It's a comprehensive overview that connects the charts volatility, trends, divergences, credit, and currency strength.
In this chart, the RVX had RSI divergences prior to the corrections. In addition, the RVX created 3-4 higher lows in a row prior to a correction.
This is a project that my trading team and I are conducting. This is 4 of 9 charts (available on Trading View) that searches for clues for an imminent correction by using both June and September 2020 cases. It's a comprehensive overview that connects the charts volatility, trends, divergences, credit, and currency strength.
In this chart, the RVX had RSI divergences prior to the corrections. In addition, the RVX created 3-4 higher lows in a row prior to a correction.

כתב ויתור
המידע והפרסומים אינם מיועדים להיות, ואינם מהווים, ייעוץ או המלצה פיננסית, השקעתית, מסחרית או מכל סוג אחר המסופקת או מאושרת על ידי TradingView. קרא עוד ב־תנאי השימוש.
כתב ויתור
המידע והפרסומים אינם מיועדים להיות, ואינם מהווים, ייעוץ או המלצה פיננסית, השקעתית, מסחרית או מכל סוג אחר המסופקת או מאושרת על ידי TradingView. קרא עוד ב־תנאי השימוש.