מעודכן
Soybean - A Descending Triangle Pattern
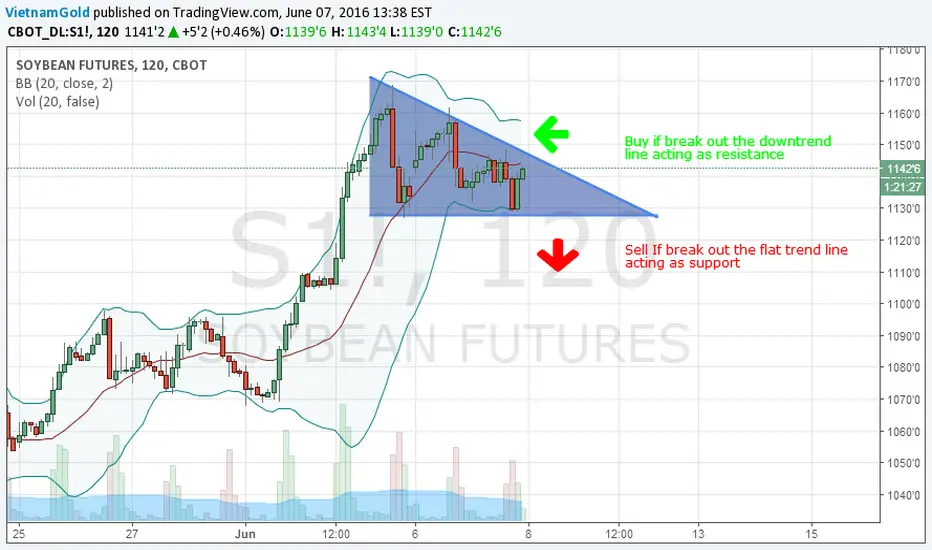
Le'ts take a look at the Soybean Futures market by examining its 2hr chart. What do we see:
- Price has consolidated in a descending triangle.
- Support @1130 running flat
- Resistance is the downtrend line.
- A break out of either way will tell us about its next going direction.
A descending triangle is usually a continuation pattern so here the upside is favored as Soybean price is bullish in daily and weekly chart. There are instances when descending triangles form as reversal patterns at the end of an uptrend, but they are typically continuation patterns.
Stay Tuned.
עסקה פעילה
Bought 10 contracts @11.4725 since price broke out to the upsideהערה
Price is accelerating to the upside after break out.העסקה בוטלה באופן ידני
Closed my trade @11.8725
כתב ויתור
המידע והפרסומים אינם מיועדים להיות, ואינם מהווים, ייעוץ או המלצה פיננסית, השקעתית, מסחרית או מכל סוג אחר המסופקת או מאושרת על ידי TradingView. קרא עוד ב־תנאי השימוש.
כתב ויתור
המידע והפרסומים אינם מיועדים להיות, ואינם מהווים, ייעוץ או המלצה פיננסית, השקעתית, מסחרית או מכל סוג אחר המסופקת או מאושרת על ידי TradingView. קרא עוד ב־תנאי השימוש.