
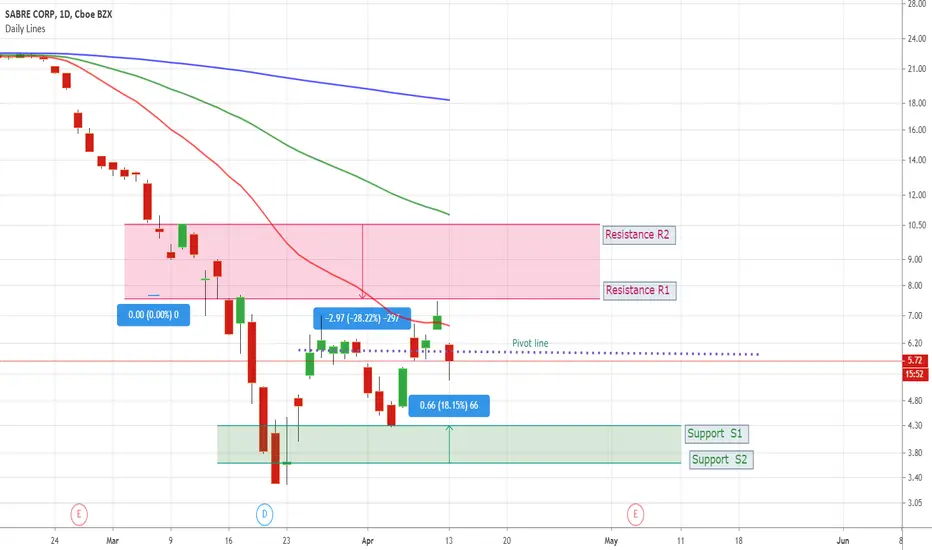
SABR S1/S2 and R1/R2 with Pivot line based on my own analysis
These S/R lines are NOT the calculated standard formula Support and Resistance levels.
These are based on reading and my own analysis of the Price action over last 2 weeks.
Pivot Line is the Line where SABR price action 'pass thru' MOST candles bars in the last 2 weeks .
My analysis is that these S/R lines are good for 'next 10 trading days '
These S/R lines are NOT the calculated standard formula Support and Resistance levels.
These are based on reading and my own analysis of the Price action over last 2 weeks.
Pivot Line is the Line where SABR price action 'pass thru' MOST candles bars in the last 2 weeks .
My analysis is that these S/R lines are good for 'next 10 trading days '

כתב ויתור
המידע והפרסומים אינם מיועדים להיות, ואינם מהווים, ייעוץ או המלצה פיננסית, השקעתית, מסחרית או מכל סוג אחר המסופקת או מאושרת על ידי TradingView. קרא עוד ב־תנאי השימוש.
כתב ויתור
המידע והפרסומים אינם מיועדים להיות, ואינם מהווים, ייעוץ או המלצה פיננסית, השקעתית, מסחרית או מכל סוג אחר המסופקת או מאושרת על ידי TradingView. קרא עוד ב־תנאי השימוש.