
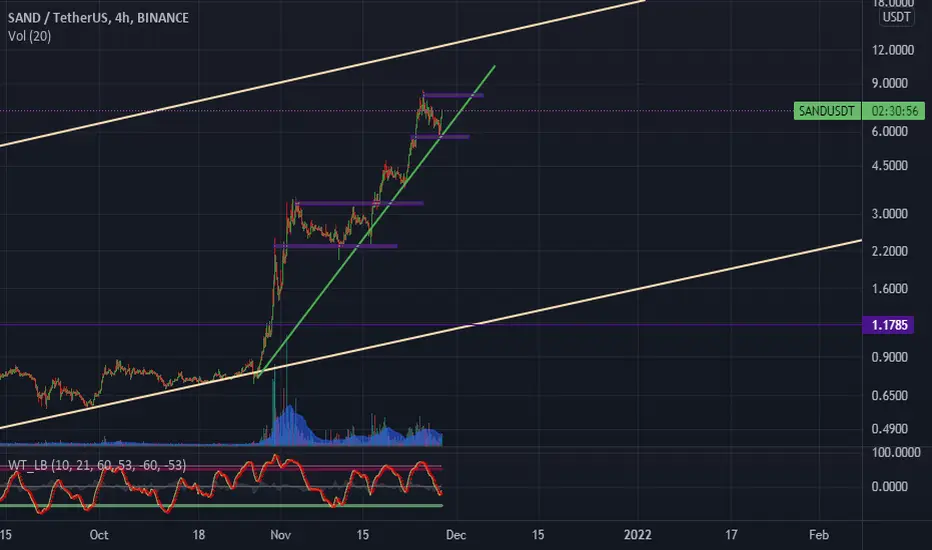
sand usdt analyses
time frame 4 Hours
we can see green uptrend line( short term) between two creme uptrend line (long term)
we can see when price hits green line , price reacts and grows
also we can see when wave is going up in indicator in bottom of chart . when price hit the green line
sorry for my very very bad English but I hope it was useful for you

כתב ויתור
המידע והפרסומים אינם מיועדים להיות, ואינם מהווים, ייעוץ או המלצה פיננסית, השקעתית, מסחרית או מכל סוג אחר המסופקת או מאושרת על ידי TradingView. קרא עוד ב־תנאי השימוש.
כתב ויתור
המידע והפרסומים אינם מיועדים להיות, ואינם מהווים, ייעוץ או המלצה פיננסית, השקעתית, מסחרית או מכל סוג אחר המסופקת או מאושרת על ידי TradingView. קרא עוד ב־תנאי השימוש.