
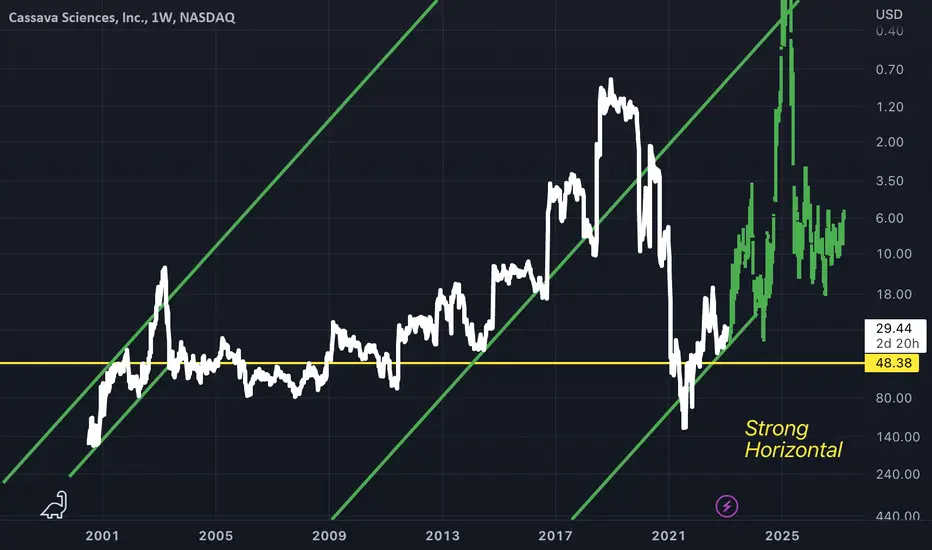
Slanted Double Bottom
This can be also observed earlier in prices history, again along the strong horizontal in yellow which is the most important take away from this chart
Bars pattern placed in green is just an example of how price could recover
Bullish above the horizontal
This can be also observed earlier in prices history, again along the strong horizontal in yellow which is the most important take away from this chart
Bars pattern placed in green is just an example of how price could recover
Bullish above the horizontal

כתב ויתור
המידע והפרסומים אינם מיועדים להיות, ואינם מהווים, ייעוץ או המלצה פיננסית, השקעתית, מסחרית או מכל סוג אחר המסופקת או מאושרת על ידי TradingView. קרא עוד ב־תנאי השימוש.
כתב ויתור
המידע והפרסומים אינם מיועדים להיות, ואינם מהווים, ייעוץ או המלצה פיננסית, השקעתית, מסחרית או מכל סוג אחר המסופקת או מאושרת על ידי TradingView. קרא עוד ב־תנאי השימוש.