
ANALYSIS 🔎
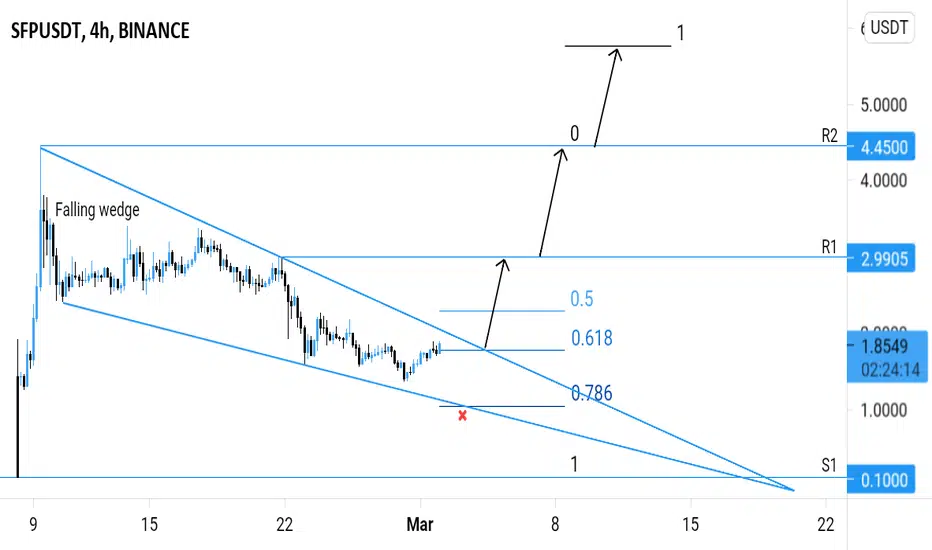
- SFPUSDT is printing a falling wedge pattern.
- A falling wedge pattern is a bullish reversal pattern.
- Price is testing the key fibonacci retracement levels (0.5 - 0.618 - 0.786).
- There's a breakout potential.
BUY ENTRY ⬆️
- Breakout above the falling wedge's resistance.
TARGETS 🎯
- Horizontal resistance level (R1).
- Horizontal resistance level (R2).
- Fibonacci extension levels.
SETUP INVALIDATION ❌
- Breakdown below the falling wedge's support.
- SFPUSDT is printing a falling wedge pattern.
- A falling wedge pattern is a bullish reversal pattern.
- Price is testing the key fibonacci retracement levels (0.5 - 0.618 - 0.786).
- There's a breakout potential.
BUY ENTRY ⬆️
- Breakout above the falling wedge's resistance.
TARGETS 🎯
- Horizontal resistance level (R1).
- Horizontal resistance level (R2).
- Fibonacci extension levels.
SETUP INVALIDATION ❌
- Breakdown below the falling wedge's support.

כתב ויתור
המידע והפרסומים אינם מיועדים להיות, ואינם מהווים, ייעוץ או המלצה פיננסית, השקעתית, מסחרית או מכל סוג אחר המסופקת או מאושרת על ידי TradingView. קרא עוד ב־תנאי השימוש.
כתב ויתור
המידע והפרסומים אינם מיועדים להיות, ואינם מהווים, ייעוץ או המלצה פיננסית, השקעתית, מסחרית או מכל סוג אחר המסופקת או מאושרת על ידי TradingView. קרא עוד ב־תנאי השימוש.