שורט
SHOP- rectangle pattern - short
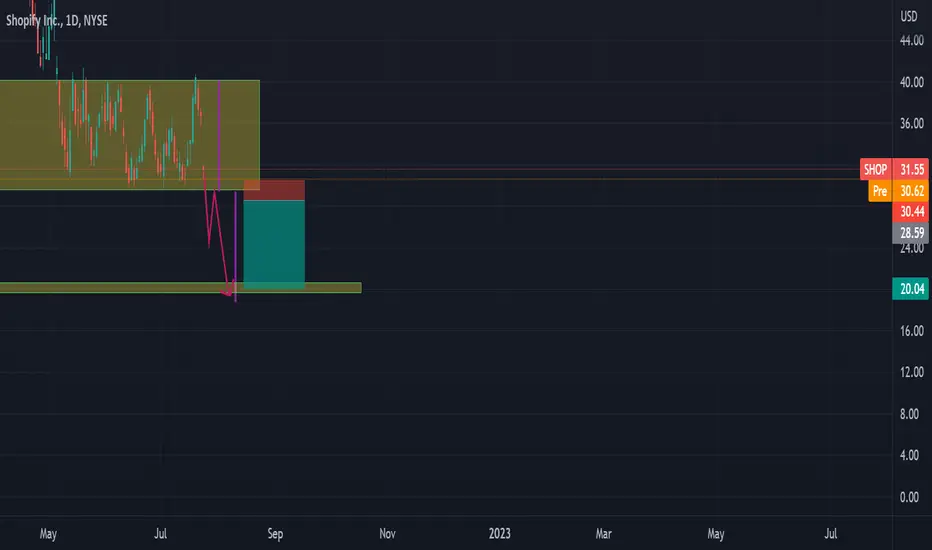
Shopify stock is in the range . It looks like the price is creating a rectangle pattern which may break to the downside.
Enter the trade if the price breaks below the rectangle and it retests the bottom of the rectangle as a resistance .
Target and the stop loss are shown in the chart.
Enter the trade if the price breaks below the rectangle and it retests the bottom of the rectangle as a resistance .
Target and the stop loss are shown in the chart.

💥 Free signals and ideas ➡ t.me/vfinvestment
כתב ויתור
המידע והפרסומים אינם מיועדים להיות, ואינם מהווים, ייעוץ או המלצה פיננסית, השקעתית, מסחרית או מכל סוג אחר המסופקת או מאושרת על ידי TradingView. קרא עוד ב־תנאי השימוש.
💥 Free signals and ideas ➡ t.me/vfinvestment
כתב ויתור
המידע והפרסומים אינם מיועדים להיות, ואינם מהווים, ייעוץ או המלצה פיננסית, השקעתית, מסחרית או מכל סוג אחר המסופקת או מאושרת על ידי TradingView. קרא עוד ב־תנאי השימוש.