
The primary trend (weekly TF) of Silver turned bearish since the beginning of the year.
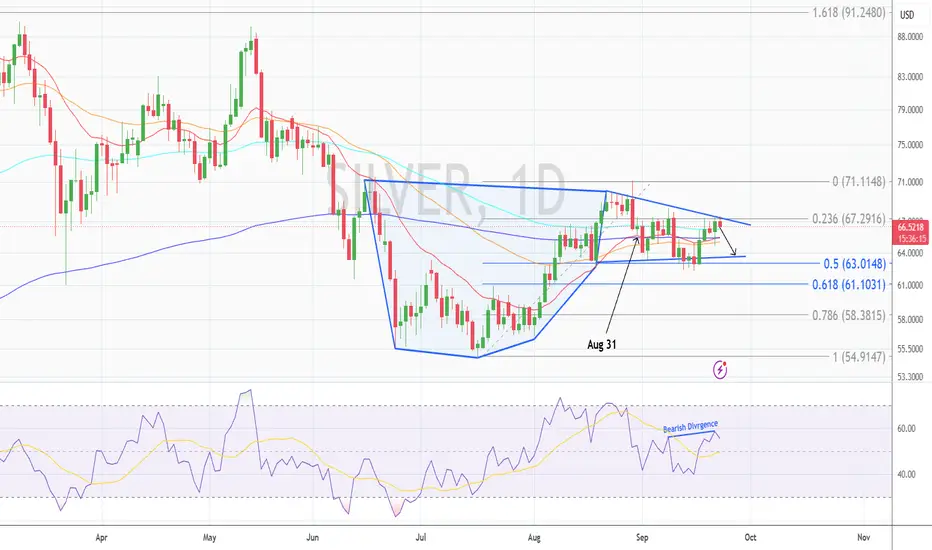
On a daily chart, silver is forming a cup & handle pattern, and prices are testing a confluence of resistance while trending within the handle of the pattern:
1. The upper zone of he handle
2. The fib level 0.236 (67.30) - this level is acting as strong resistance as prices failed to give a higher close since Aug 31.
RSI is also forming a bearish divergence with the prices.
Overall, prices are expected to decline at least till the EMA cluster (~65.30) or lower towards the lower territory of the handle near fib level 0.5 (63.00)
Alternative Scenario:
- The prices recently rose, taking support of the fib level 0.50 (63.00), and rose above the EMA cluster.
- But only a breakout above the fib level 0.236 (67.30) and above the handle will decisively drive prices to higher resistance levels
On a daily chart, silver is forming a cup & handle pattern, and prices are testing a confluence of resistance while trending within the handle of the pattern:
1. The upper zone of he handle
2. The fib level 0.236 (67.30) - this level is acting as strong resistance as prices failed to give a higher close since Aug 31.
RSI is also forming a bearish divergence with the prices.
Overall, prices are expected to decline at least till the EMA cluster (~65.30) or lower towards the lower territory of the handle near fib level 0.5 (63.00)
Alternative Scenario:
- The prices recently rose, taking support of the fib level 0.50 (63.00), and rose above the EMA cluster.
- But only a breakout above the fib level 0.236 (67.30) and above the handle will decisively drive prices to higher resistance levels

כתב ויתור
המידע והפרסומים אינם מיועדים להיות, ואינם מהווים, ייעוץ או המלצה פיננסית, השקעתית, מסחרית או מכל סוג אחר המסופקת או מאושרת על ידי TradingView. קרא עוד ב־תנאי השימוש.
כתב ויתור
המידע והפרסומים אינם מיועדים להיות, ואינם מהווים, ייעוץ או המלצה פיננסית, השקעתית, מסחרית או מכל סוג אחר המסופקת או מאושרת על ידי TradingView. קרא עוד ב־תנאי השימוש.