
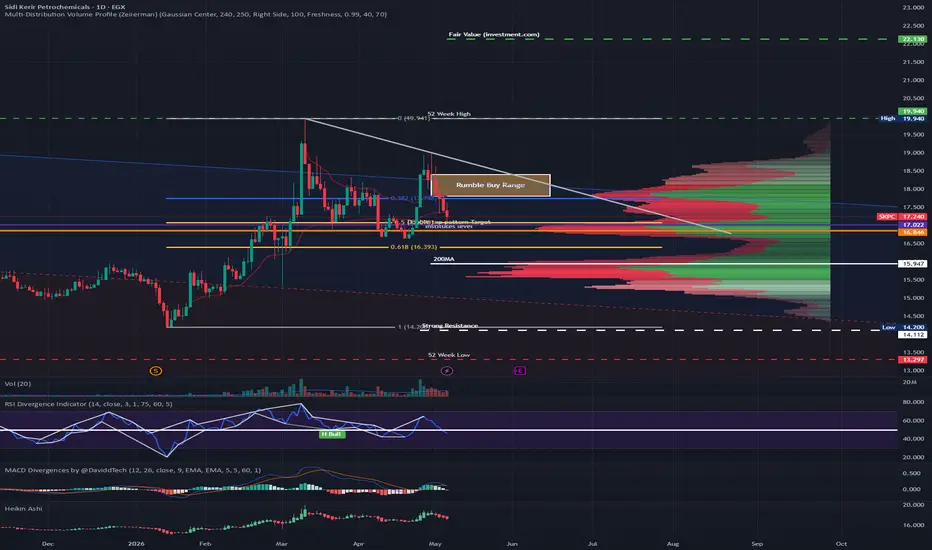
SKPC Retest & Rebound Zone 🧪📉✨
I am tracking Sidi Kerir Petrochemicals (SKPC) as it approaches a high-confluence support zone. After a period of correction, the stock is nearing a level where the "big money" 🏛️💸
typically steps back in.
The Double Top & Fib Alignment: The stock is currently fulfilling the technical target of a Double Top pattern. 📉🚩
This move aligns perfectly with the 50% Fibonacci level measured from the last major bottom to the All-Time High (ATH).
This level has historically acted as a strong "springboard" for the price. 🏹🎯
Support & Liquidity: The 17.00 EGP level is more than just a number; it sits directly atop a major structural support floor. 🧱⚓
I am seeing significant liquidity clusters sitting just below this level, suggesting that institutional buy orders are likely waiting to absorb the selling pressure. 🛒🔥
Volume & VWAP: Price action is currently trading below the Anchored VWAP from the last major dip, indicating an "oversold" state relative to the average weighted price. 📊📉
Crucially, volume has been decreasing every day last week this "drying up" of selling pressure is a classic sign that the bears are exhausted and a reversal is brewing. 🛑⛽
The Strategy: Eyes on 17.00 EGP. 🔍👀
If we see a bullish reversal candle (like a hammer or engulfing pattern) on rising volume at this level, it confirms the rebound.
This is a high-probability "buy the dip" zone for those looking for a move back toward the 20.00+ levels. 🧘♂️🎯💎
If you like my insights, please follow and boost 🙌💙🚀
🎁 Get a $15 discount on your next subscription:
🔗 tradingview.com/pricing/?share_your_love=mnmabroukw36ix ✨💸🤑
I am tracking Sidi Kerir Petrochemicals (SKPC) as it approaches a high-confluence support zone. After a period of correction, the stock is nearing a level where the "big money" 🏛️💸
typically steps back in.
The Double Top & Fib Alignment: The stock is currently fulfilling the technical target of a Double Top pattern. 📉🚩
This move aligns perfectly with the 50% Fibonacci level measured from the last major bottom to the All-Time High (ATH).
This level has historically acted as a strong "springboard" for the price. 🏹🎯
Support & Liquidity: The 17.00 EGP level is more than just a number; it sits directly atop a major structural support floor. 🧱⚓
I am seeing significant liquidity clusters sitting just below this level, suggesting that institutional buy orders are likely waiting to absorb the selling pressure. 🛒🔥
Volume & VWAP: Price action is currently trading below the Anchored VWAP from the last major dip, indicating an "oversold" state relative to the average weighted price. 📊📉
Crucially, volume has been decreasing every day last week this "drying up" of selling pressure is a classic sign that the bears are exhausted and a reversal is brewing. 🛑⛽
The Strategy: Eyes on 17.00 EGP. 🔍👀
If we see a bullish reversal candle (like a hammer or engulfing pattern) on rising volume at this level, it confirms the rebound.
This is a high-probability "buy the dip" zone for those looking for a move back toward the 20.00+ levels. 🧘♂️🎯💎
If you like my insights, please follow and boost 🙌💙🚀
🎁 Get a $15 discount on your next subscription:
🔗 tradingview.com/pricing/?share_your_love=mnmabroukw36ix ✨💸🤑

פרסומים קשורים
כתב ויתור
המידע והפרסומים אינם מיועדים להיות, ואינם מהווים, ייעוץ או המלצה פיננסית, השקעתית, מסחרית או מכל סוג אחר המסופקת או מאושרת על ידי TradingView. קרא עוד ב־תנאי השימוש.
כתב ויתור
המידע והפרסומים אינם מיועדים להיות, ואינם מהווים, ייעוץ או המלצה פיננסית, השקעתית, מסחרית או מכל סוג אחר המסופקת או מאושרת על ידי TradingView. קרא עוד ב־תנאי השימוש.