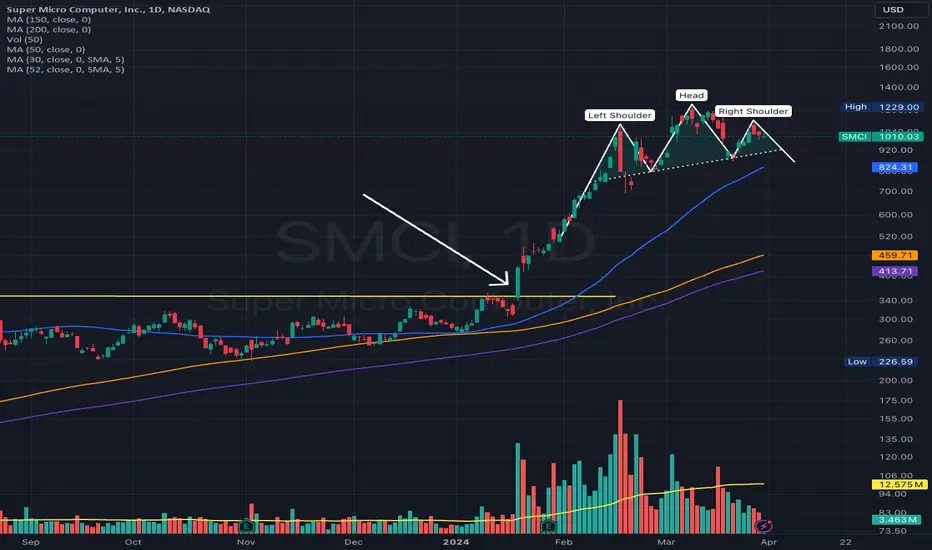
 SMCI is a clear leader during this bull market. However, after a 260% run-up from a previous buy point as shown on the chart, the stock is struggling to move up further.
Now it might slowly form a Head & Shoulders Pattern, and a breakdown through the neckline would signal a sell.
Interestingly, the neckline is right near the 50-day moving average (blue line), therefore a breakdown there will be an even stronger sell signal.
הערה
On April 9, 2024, the stock already moved down the neckline. However, to be clear, I absolutely do not plan to short SMCI or any other stocks. I am looking for reversal pattern at the top ONLY to sell which I have already bought, to close the trade.
Shorting stocks, especially tech stocks, in my opinion, is very risky.

כתב ויתור
המידע והפרסומים אינם מיועדים להיות, ואינם מהווים, ייעוץ או המלצה פיננסית, השקעתית, מסחרית או מכל סוג אחר המסופקת או מאושרת על ידי TradingView. קרא עוד ב־תנאי השימוש.
כתב ויתור
המידע והפרסומים אינם מיועדים להיות, ואינם מהווים, ייעוץ או המלצה פיננסית, השקעתית, מסחרית או מכל סוג אחר המסופקת או מאושרת על ידי TradingView. קרא עוד ב־תנאי השימוש.