 SMH
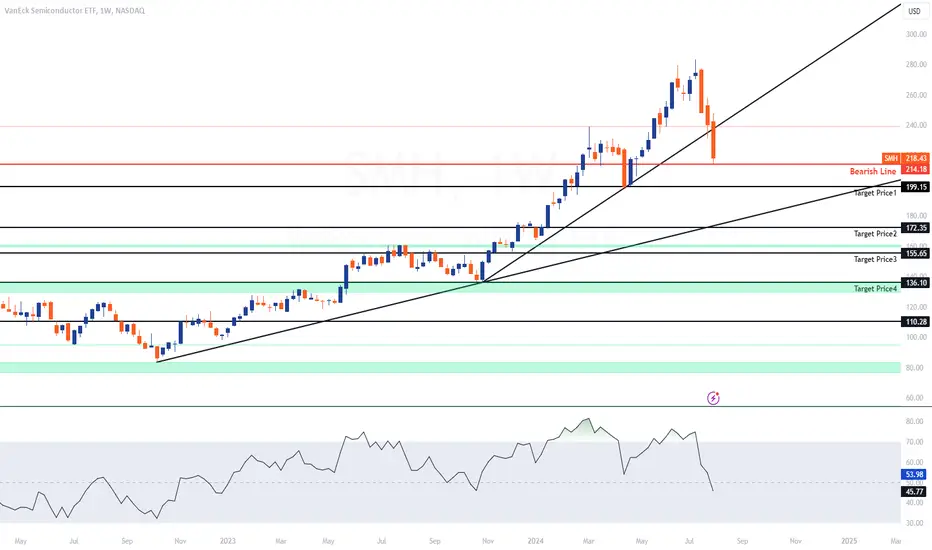
VanEck Semiconductor ETF (SMH) Weekly Analysis:
Current Price Action:
SMH is trading at $218.43, down 9.10% for the week.
Price has breached the upward trendline support, indicating potential further downside.
Key Levels:
Bearish Line: $214.18
Target Price 1: $199.15
Target Price 2: $172.35
Target Price 3: $155.65
Target Price 4: $136.10
Support Zones:
Immediate support is expected around $199.15.
Further support levels are $172.35, $155.65, and $136.10.
Resistance Levels:
Resistance is at the broken trendline near $240, followed by the recent high around $300.
Relative Strength Index (RSI):
RSI is at 53.98, trending downwards, suggesting weakening momentum.
Volume:
Volume is significant at 75.462M, indicating strong selling pressure.
Conclusion:
SMH's breakdown below key support levels and significant bearish momentum suggest further downside potential. Watch for reactions around $199.15 and $172.35 for potential entry points or further declines.
עסקה סגורה: היעד הושג
Target Price 1: $199.15הערה
TP2 HIT
פרסומים קשורים
כתב ויתור
המידע והפרסומים אינם מיועדים להיות, ואינם מהווים, ייעוץ או המלצה פיננסית, השקעתית, מסחרית או מכל סוג אחר המסופקת או מאושרת על ידי TradingView. קרא עוד ב־תנאי השימוש.
פרסומים קשורים
כתב ויתור
המידע והפרסומים אינם מיועדים להיות, ואינם מהווים, ייעוץ או המלצה פיננסית, השקעתית, מסחרית או מכל סוג אחר המסופקת או מאושרת על ידי TradingView. קרא עוד ב־תנאי השימוש.