
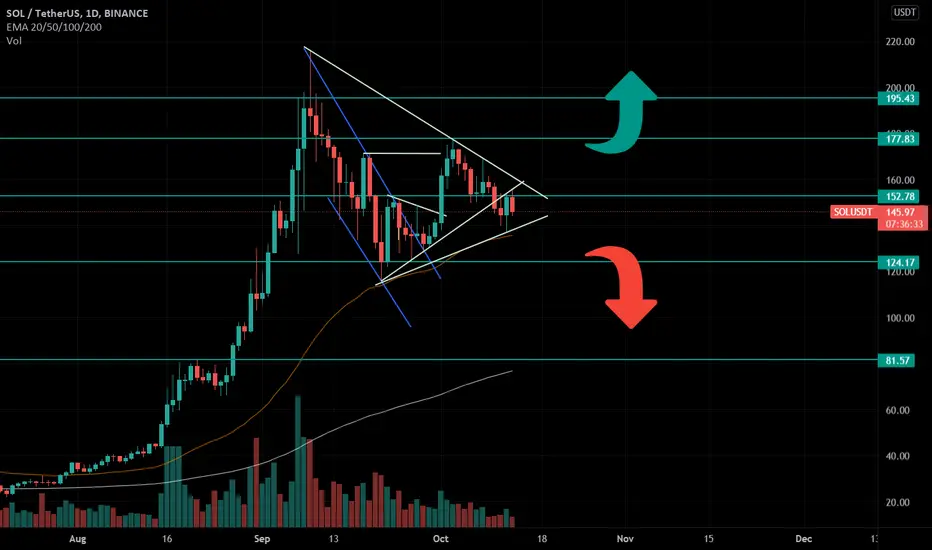
Quick chart analysis of SOL in 1 day time frame where we can see a symmetrical triangle taking place right now, in the daily chart SOL has a bullish trend so this symmetrical triangle is more likely to break to the upside but anyways we want to wait till further movement confirmation.
הערה
The symmetrical triangle is breaking to the upside right now, but we don't see much volume getting in as we would want to see.הערה
A nice break to the upsideהעסקה בוטלה באופן ידני
We saw a nice rally to the upside and a rejection at the previous ATH.This analysis is over now.

כתב ויתור
המידע והפרסומים אינם מיועדים להיות, ואינם מהווים, ייעוץ או המלצה פיננסית, השקעתית, מסחרית או מכל סוג אחר המסופקת או מאושרת על ידי TradingView. קרא עוד ב־תנאי השימוש.
כתב ויתור
המידע והפרסומים אינם מיועדים להיות, ואינם מהווים, ייעוץ או המלצה פיננסית, השקעתית, מסחרית או מכל סוג אחר המסופקת או מאושרת על ידי TradingView. קרא עוד ב־תנאי השימוש.