
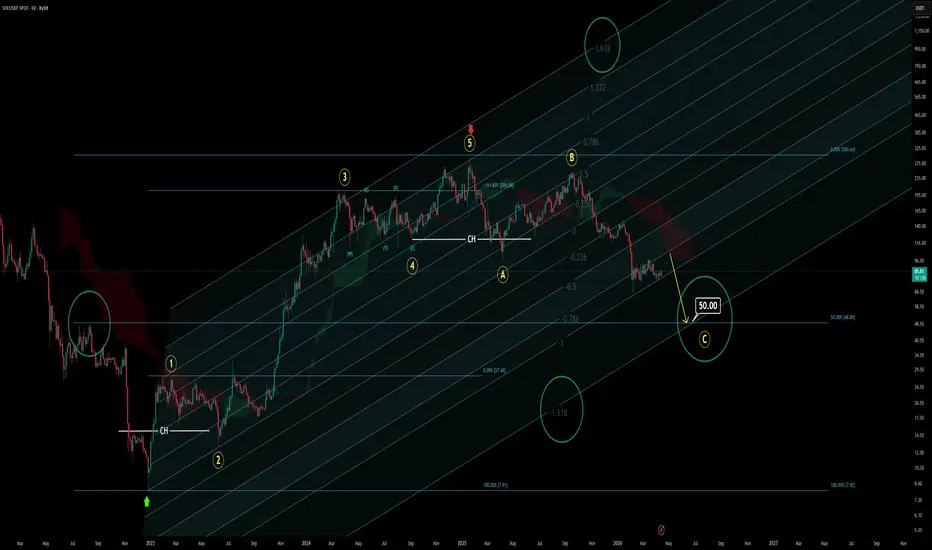
SOL is facing one of its most devastating declines since September, and the reasons are clearer than you might think.
The red arrow on the chart marks where Wave 5 ended. If you examine past movements, a clear pattern emerges. Wave 3 of the bullish phase was far more extended than the market expected. This can be explained by combining Fibonacci channels and ratios. This unexpected extension of Wave 3 was caused by the memecoin hype over the last year. This same extension also caused Wave 5 to end earlier than expected. That is why Solana was unable to reach new all-time highs while Bitcoin did during last year's rally.
For Solana, last year’s rally was a correction. Right before wave B started, a visible change in character appeared on higher time frames. This trapped many traders in short positions because they believed it was time to short.
There are multiple ways to tell a story. For this chart, you could say, "hey, there is a bear flag!" or "a head and shoulders pattern has formed!" Both would be true, just like other methods. The main thing to consider is: what is the target?
What I see at the moment is simple: Solana is in Wave C, and it is actually nearing its end. Use a simple Fibonacci retracement tool and measure from the latest high to the very bottom. You’ll find that the 50% level of this move is close to $50.
Then, use a Fibonacci channel as I do and check where the main impulsive Wave 3 ended. You’ll realize it is extending to 1.618, which will be the same for Wave C. You don’t have to calculate another Fibonacci channel; just go to the settings and type "-1.618". If the Fibonacci retracement's 50% target and the Fibonacci channel's -1.618 target align, well, that is your target for Wave C.
Thanks for reading.
Skyress
The red arrow on the chart marks where Wave 5 ended. If you examine past movements, a clear pattern emerges. Wave 3 of the bullish phase was far more extended than the market expected. This can be explained by combining Fibonacci channels and ratios. This unexpected extension of Wave 3 was caused by the memecoin hype over the last year. This same extension also caused Wave 5 to end earlier than expected. That is why Solana was unable to reach new all-time highs while Bitcoin did during last year's rally.
For Solana, last year’s rally was a correction. Right before wave B started, a visible change in character appeared on higher time frames. This trapped many traders in short positions because they believed it was time to short.
There are multiple ways to tell a story. For this chart, you could say, "hey, there is a bear flag!" or "a head and shoulders pattern has formed!" Both would be true, just like other methods. The main thing to consider is: what is the target?
What I see at the moment is simple: Solana is in Wave C, and it is actually nearing its end. Use a simple Fibonacci retracement tool and measure from the latest high to the very bottom. You’ll find that the 50% level of this move is close to $50.
Then, use a Fibonacci channel as I do and check where the main impulsive Wave 3 ended. You’ll realize it is extending to 1.618, which will be the same for Wave C. You don’t have to calculate another Fibonacci channel; just go to the settings and type "-1.618". If the Fibonacci retracement's 50% target and the Fibonacci channel's -1.618 target align, well, that is your target for Wave C.
Thanks for reading.
Skyress
עסקה פעילה
It's gonna be a painfull thing to watch but it's ON.
פרסומים קשורים
כתב ויתור
המידע והפרסומים אינם מיועדים להיות, ואינם מהווים, ייעוץ או המלצה פיננסית, השקעתית, מסחרית או מכל סוג אחר המסופקת או מאושרת על ידי TradingView. קרא עוד ב־תנאי השימוש.
פרסומים קשורים
כתב ויתור
המידע והפרסומים אינם מיועדים להיות, ואינם מהווים, ייעוץ או המלצה פיננסית, השקעתית, מסחרית או מכל סוג אחר המסופקת או מאושרת על ידי TradingView. קרא עוד ב־תנאי השימוש.