
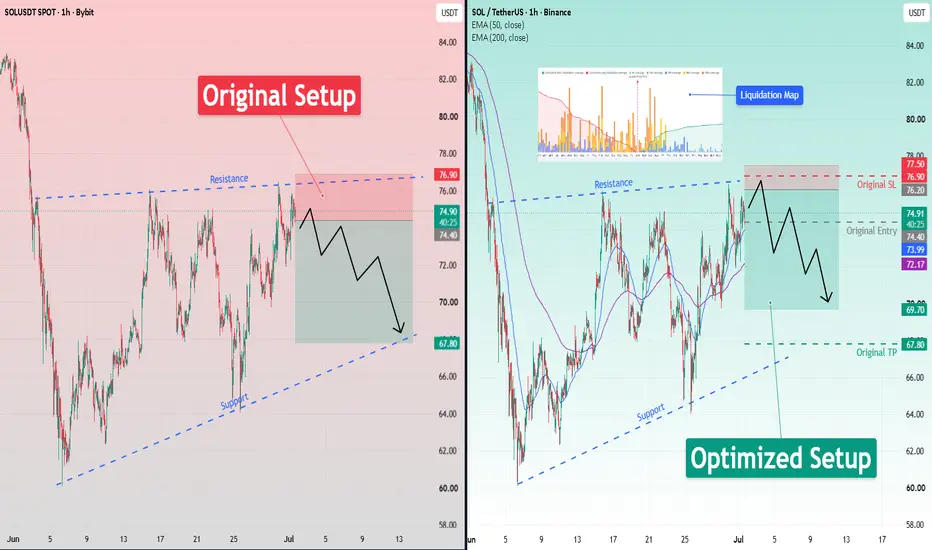
I am stress-testing a SOL short setup today that attempts to play resistance at 76 down to support at 67. The original parameters are an entry at 74.4, a take-profit at 67.8, and a stop-loss at 76.9. My goal is to take this raw thesis and optimize these exact levels using a liquidation map and EMA data.
I noted the original idea correctly identified the bearish market bias. The 103.61M net delta heavily supports a short.
However, shorting at 74.4 is vulnerable to an upward squeeze. The entry was moved to 76.2 to target the core of the massive 59.51M resistance cluster.
This allows the market to sweep recent highs and grab liquidity before reversing.
The original take-profit of 67.8 is unnecessarily greedy since major support terminates at 68.7. The target was adjusted to 69.7 to safely capture the 66.84M liquidation zone.
I saw the original stop-loss was placed directly inside the primary liquidation cluster at 76.9. It was fundamentally flawed and prime bait for a wick sweep.
The stop was moved to 77.5 to sit safely outside the resistance cluster and above the major swing high.
By absorbing the liquidity sweep and securing a high-probability target, the risk-adjusted return was drastically improved from a 1:2.64 to a 1:5 ratio.
I think it will be interesting to watch the live market to see which specific setup actually performs better.
I noted the original idea correctly identified the bearish market bias. The 103.61M net delta heavily supports a short.
However, shorting at 74.4 is vulnerable to an upward squeeze. The entry was moved to 76.2 to target the core of the massive 59.51M resistance cluster.
This allows the market to sweep recent highs and grab liquidity before reversing.
The original take-profit of 67.8 is unnecessarily greedy since major support terminates at 68.7. The target was adjusted to 69.7 to safely capture the 66.84M liquidation zone.
I saw the original stop-loss was placed directly inside the primary liquidation cluster at 76.9. It was fundamentally flawed and prime bait for a wick sweep.
The stop was moved to 77.5 to sit safely outside the resistance cluster and above the major swing high.
By absorbing the liquidity sweep and securing a high-probability target, the risk-adjusted return was drastically improved from a 1:2.64 to a 1:5 ratio.
I think it will be interesting to watch the live market to see which specific setup actually performs better.
עסקה סגורה: הגיע לסטופ
Sucks that my trade hit stop loss, but I'm glad the optimization cut the loss down from -3.3% to -1.6%.
🤖 I optimize my trade setups with this AI Telegram bot (EN/RU):
🔗 t.me/sharkcouncil_bot
🔗 t.me/sharkcouncil_bot
כתב ויתור
המידע והפרסומים אינם מיועדים להיות, ואינם מהווים, ייעוץ או המלצה פיננסית, השקעתית, מסחרית או מכל סוג אחר המסופקת או מאושרת על ידי TradingView. קרא עוד ב־תנאי השימוש.
🤖 I optimize my trade setups with this AI Telegram bot (EN/RU):
🔗 t.me/sharkcouncil_bot
🔗 t.me/sharkcouncil_bot
כתב ויתור
המידע והפרסומים אינם מיועדים להיות, ואינם מהווים, ייעוץ או המלצה פיננסית, השקעתית, מסחרית או מכל סוג אחר המסופקת או מאושרת על ידי TradingView. קרא עוד ב־תנאי השימוש.