
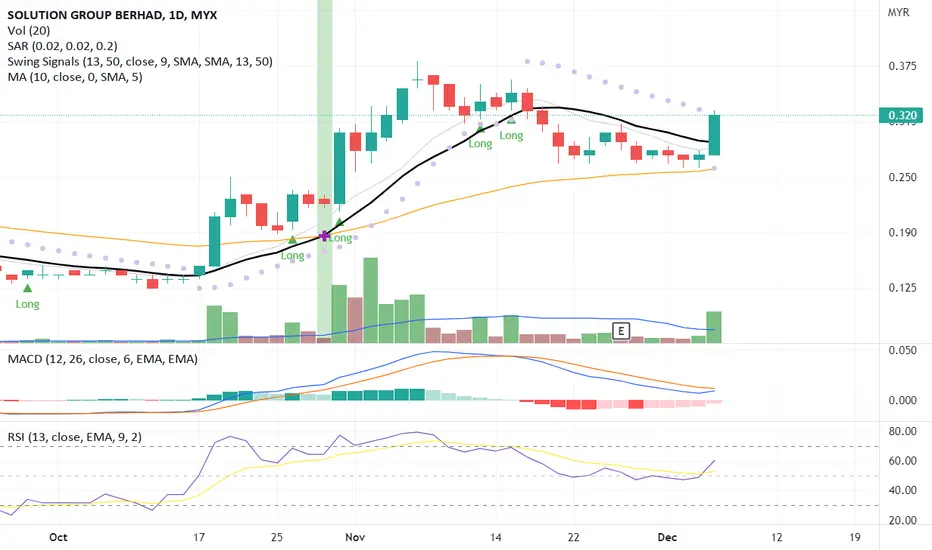
The candlestick pattern indicates a price breakout signal right above the MA13 line due to significant price movement backed by high volume.
The MACD and RSI also show a positive reading which indicates a divergence signal.
Let's SOLUTN in WL and watch out for significant price movement toward the next price resistance.
R 0.380
S 0.270
The MACD and RSI also show a positive reading which indicates a divergence signal.
Let's SOLUTN in WL and watch out for significant price movement toward the next price resistance.
R 0.380
S 0.270

כתב ויתור
המידע והפרסומים אינם מיועדים להיות, ואינם מהווים, ייעוץ או המלצה פיננסית, השקעתית, מסחרית או מכל סוג אחר המסופקת או מאושרת על ידי TradingView. קרא עוד ב־תנאי השימוש.
כתב ויתור
המידע והפרסומים אינם מיועדים להיות, ואינם מהווים, ייעוץ או המלצה פיננסית, השקעתית, מסחרית או מכל סוג אחר המסופקת או מאושרת על ידי TradingView. קרא עוד ב־תנאי השימוש.