The Great Rotation Seems Real
The Call:
Semiconductor Weakness Playing Out
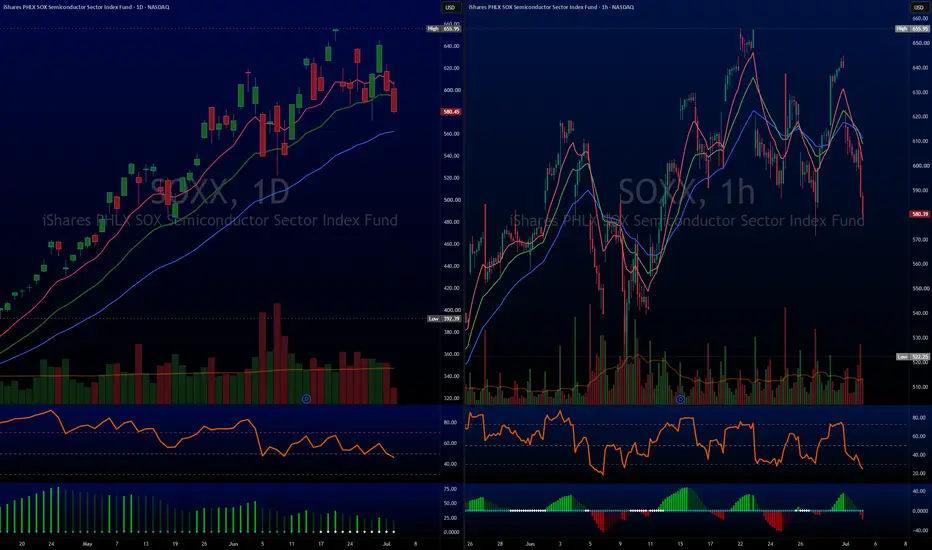
The alarm we sounded on the semiconductor sector is actively executing. Looking at the iShares Semiconductor ETF ( SOXX) on the daily chart, price action is heavily threatening its intermediate blue EMA support.
The Confirmation Bars:
Those three massive institutional distribution volume bars we flagged back in June were the real deal. They signaled that big funds were quietly hitting the exits while retail was buying the highs.
4 Hour Breakdown:
On the 4 hour chart, the fast EMAs (Exponential Moving Avgs > RED & GREEN) are on the verge of a definitive bearish crossover, and the TTM Squeeze momentum has flipped completely negative. If the daily green and blue moving averages give way, those lower structural gaps remain the primary target.
The Pivot:
Capital is Rotating, Not Fleeing
While the tech/chip sector is flushing, look at the Dow Jones Industrial Average ( DJI) showing massive relative strength, trading up.
This stark divergence tells you everything you need to know about current market structure:
This is not a liquidity panic or a systemic market meltdown.
This is a textbook capital rotation out of heavily overextended, high beta tech names directly into cyclical, value, and defensive blue chips. Only issue might be $INTC.
Conclusion
The bearish divergence we caught on theSOXX RSI and Chaikin Money Flow gave us the perfect heads up. Protect your tech capital, but don't short the entire market blindly money is simply changing addresses.
The Call:
Semiconductor Weakness Playing Out
The alarm we sounded on the semiconductor sector is actively executing. Looking at the iShares Semiconductor ETF (
SOXX) on the daily chart, price action is heavily threatening its intermediate blue EMA support.The Confirmation Bars:
Those three massive institutional distribution volume bars we flagged back in June were the real deal. They signaled that big funds were quietly hitting the exits while retail was buying the highs.
4 Hour Breakdown:
On the 4 hour chart, the fast EMAs (Exponential Moving Avgs > RED & GREEN) are on the verge of a definitive bearish crossover, and the TTM Squeeze momentum has flipped completely negative. If the daily green and blue moving averages give way, those lower structural gaps remain the primary target.
The Pivot:
Capital is Rotating, Not Fleeing
While the tech/chip sector is flushing, look at the Dow Jones Industrial Average (
DJI) showing massive relative strength, trading up.This stark divergence tells you everything you need to know about current market structure:
This is not a liquidity panic or a systemic market meltdown.
This is a textbook capital rotation out of heavily overextended, high beta tech names directly into cyclical, value, and defensive blue chips. Only issue might be $INTC.
Conclusion
The bearish divergence we caught on the
SOXX RSI and Chaikin Money Flow gave us the perfect heads up. Protect your tech capital, but don't short the entire market blindly money is simply changing addresses.
פרסומים קשורים
כתב ויתור
המידע והפרסומים אינם מיועדים להיות, ואינם מהווים, ייעוץ או המלצה פיננסית, השקעתית, מסחרית או מכל סוג אחר המסופקת או מאושרת על ידי TradingView. קרא עוד ב־תנאי השימוש.
פרסומים קשורים
כתב ויתור
המידע והפרסומים אינם מיועדים להיות, ואינם מהווים, ייעוץ או המלצה פיננסית, השקעתית, מסחרית או מכל סוג אחר המסופקת או מאושרת על ידי TradingView. קרא עוד ב־תנאי השימוש.