
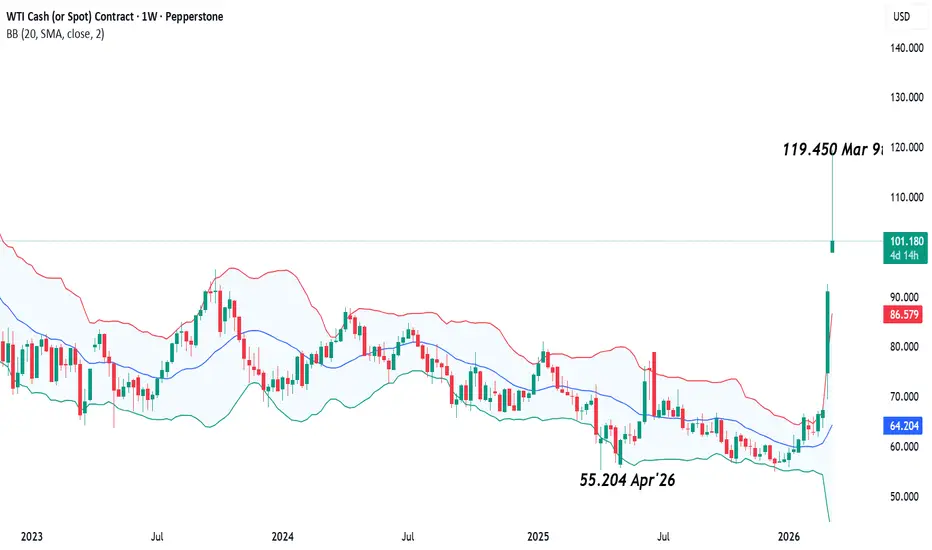
It’s been impossible to ignore the recent volatility in Oil (WTI) prices due to the knock-on impact its movement has had across all financial markets from major indices, to commodities and FX markets.
The consensus for many market participants to start 2026 was for the main driver of Oil prices in the first half of the year to be the size of the global surplus as OPEC+ and other producers not in this dominant group increased output. This led many traders to start the year short or to adopt a sell rally approach. Very few anticipated an all-out conflict between US/Israel and Iran which would close the Strait of Hormuz, blocking the flow of around 20% of the world’s supply in the process. These shorts have experienced a painful squeeze, which may have cleaned out much of the weak positioning, but also left many scratching their heads about where prices could move next.
President Trump has called for Iran to unconditionally surrender, a demand flatly refused by the ruling regime. This led to fresh attacks across Iran on Saturday and Sunday. Not only that, Bloomberg reported on Saturday that major producers in the Middle East, UAE and Kuwait were being forced to reduce output due to the on-going closure of the Strait of Hormuz restricting their access to empty shipping tankers with onshore storage already being filled quickly.
This news all led to another gap open higher for the second Monday in a row. Oil (WTI) prices jumped 30% to 119.45 this morning before slipping back to trade +12% at 102.20 (0715 GMT) assisted by a timely report released in the Financial Times which suggested an emergency meeting of G7 leaders may consider releasing barrels from strategic reserves to ease the current supply concerns.
Looking forward, Oil prices may remain highly sensitive across the next 5 days to updates on this G7 strategic reserve release, whether the conflict intensifies or cools, and if diplomatic efforts to find a solution to ease the current disruption to Middle East supply can be found.
When this type of volatility driven by geopolitical events dominates a specific market so completely it may be sensible to reduce position sizes to accommodate the potential necessity for wider stop loss parameters, which can also be matched by equivalent wider take profit targets. Assessing the technical backdrop to identify significant levels that could impact any trading plan and execution decision making can also be helpful.
Technical Update: Gauging Potential Resistance and Correction Support Levels:
Geopolitical volatility was the main driver of Oil sentiment last week and so far, this morning (Monday 9th March), triggering a sharp acceleration higher and pushing prices to levels last seen in June 2022. This surge is naturally prompting traders to ask the key questions: Can prices extend even higher? And if the market pulls back after such strong gains, where might the next support emerge?
Below, we outline possible answers to both questions./b]
Do Prices Have Potential to Extend to Even Higher Levels?
It’s impossible to know how much further the current price strength can extend, or even whether it will, because so much depends on future developments in Iran and the wider Middle East. However, by looking at the weekly chart below, we can identify the next potential resistance levels. These levels might help us to gauge where the current advance might at least slow or even stall, or, if the levels are broken on a closing basis, where further upside momentum might develop from.

As the chart above shows, this morning’s further strength has seen prices near a potential key resistance level at 124.126, which corresponds to the June 2022 failure high. How the market reacts to this level on a closing basis could be important this week. A successful break above 124.126 could act as a further positive trigger, opening scope toward 131.822, the March 2022 upside extreme, and potentially higher if that level also gives way on a closing basis.
If Prices Correct After the Recent Strength, Where Might Support Be Found?
If geopolitical concerns ease, even if that remains a big “if”, a corrective pullback in prices could develop after the latest advance. The daily chart below highlights Fibonacci retracements based on the price range established from last week’s low into this morning’s high, which might offer a useful guide to potential support levels should weakness emerge in the days ahead.

The 38.2% Fibonacci retracement of the advance sits at 100.138, and this may act as an initial support area if a corrective phase develops. A closing break below 100.138, while not guaranteeing continued downside, could open the door to deeper weakness, exposing 94.253, the 50% retracement and potentially 88.369, which is the lower 61.8% retracement.
The material provided here has not been prepared accordance with legal requirements designed to promote the independence of investment research and as such is considered to be a marketing communication. Whilst it is not subject to any prohibition on dealing ahead of the dissemination of investment research, we will not seek to take any advantage before providing it to our clients.
Pepperstone doesn’t represent that the material provided here is accurate, current or complete, and therefore shouldn’t be relied upon as such. The information, whether from a third party or not, isn’t to be considered as a recommendation; or an offer to buy or sell; or the solicitation of an offer to buy or sell any security, financial product or instrument; or to participate in any particular trading strategy. It does not take into account readers’ financial situation or investment objectives. We advise any readers of this content to seek their own advice. Without the approval of Pepperstone, reproduction or redistribution of this information isn’t permitted.
The consensus for many market participants to start 2026 was for the main driver of Oil prices in the first half of the year to be the size of the global surplus as OPEC+ and other producers not in this dominant group increased output. This led many traders to start the year short or to adopt a sell rally approach. Very few anticipated an all-out conflict between US/Israel and Iran which would close the Strait of Hormuz, blocking the flow of around 20% of the world’s supply in the process. These shorts have experienced a painful squeeze, which may have cleaned out much of the weak positioning, but also left many scratching their heads about where prices could move next.
President Trump has called for Iran to unconditionally surrender, a demand flatly refused by the ruling regime. This led to fresh attacks across Iran on Saturday and Sunday. Not only that, Bloomberg reported on Saturday that major producers in the Middle East, UAE and Kuwait were being forced to reduce output due to the on-going closure of the Strait of Hormuz restricting their access to empty shipping tankers with onshore storage already being filled quickly.
This news all led to another gap open higher for the second Monday in a row. Oil (WTI) prices jumped 30% to 119.45 this morning before slipping back to trade +12% at 102.20 (0715 GMT) assisted by a timely report released in the Financial Times which suggested an emergency meeting of G7 leaders may consider releasing barrels from strategic reserves to ease the current supply concerns.
Looking forward, Oil prices may remain highly sensitive across the next 5 days to updates on this G7 strategic reserve release, whether the conflict intensifies or cools, and if diplomatic efforts to find a solution to ease the current disruption to Middle East supply can be found.
When this type of volatility driven by geopolitical events dominates a specific market so completely it may be sensible to reduce position sizes to accommodate the potential necessity for wider stop loss parameters, which can also be matched by equivalent wider take profit targets. Assessing the technical backdrop to identify significant levels that could impact any trading plan and execution decision making can also be helpful.
Technical Update: Gauging Potential Resistance and Correction Support Levels:
Geopolitical volatility was the main driver of Oil sentiment last week and so far, this morning (Monday 9th March), triggering a sharp acceleration higher and pushing prices to levels last seen in June 2022. This surge is naturally prompting traders to ask the key questions: Can prices extend even higher? And if the market pulls back after such strong gains, where might the next support emerge?
Below, we outline possible answers to both questions./b]
Do Prices Have Potential to Extend to Even Higher Levels?
It’s impossible to know how much further the current price strength can extend, or even whether it will, because so much depends on future developments in Iran and the wider Middle East. However, by looking at the weekly chart below, we can identify the next potential resistance levels. These levels might help us to gauge where the current advance might at least slow or even stall, or, if the levels are broken on a closing basis, where further upside momentum might develop from.
As the chart above shows, this morning’s further strength has seen prices near a potential key resistance level at 124.126, which corresponds to the June 2022 failure high. How the market reacts to this level on a closing basis could be important this week. A successful break above 124.126 could act as a further positive trigger, opening scope toward 131.822, the March 2022 upside extreme, and potentially higher if that level also gives way on a closing basis.
If Prices Correct After the Recent Strength, Where Might Support Be Found?
If geopolitical concerns ease, even if that remains a big “if”, a corrective pullback in prices could develop after the latest advance. The daily chart below highlights Fibonacci retracements based on the price range established from last week’s low into this morning’s high, which might offer a useful guide to potential support levels should weakness emerge in the days ahead.
The 38.2% Fibonacci retracement of the advance sits at 100.138, and this may act as an initial support area if a corrective phase develops. A closing break below 100.138, while not guaranteeing continued downside, could open the door to deeper weakness, exposing 94.253, the 50% retracement and potentially 88.369, which is the lower 61.8% retracement.
The material provided here has not been prepared accordance with legal requirements designed to promote the independence of investment research and as such is considered to be a marketing communication. Whilst it is not subject to any prohibition on dealing ahead of the dissemination of investment research, we will not seek to take any advantage before providing it to our clients.
Pepperstone doesn’t represent that the material provided here is accurate, current or complete, and therefore shouldn’t be relied upon as such. The information, whether from a third party or not, isn’t to be considered as a recommendation; or an offer to buy or sell; or the solicitation of an offer to buy or sell any security, financial product or instrument; or to participate in any particular trading strategy. It does not take into account readers’ financial situation or investment objectives. We advise any readers of this content to seek their own advice. Without the approval of Pepperstone, reproduction or redistribution of this information isn’t permitted.

Global risk Warning CFDs are complex instruments and come with a high risk of losing money rapidly due to leverage. Between 74-89% of retail investor accounts lose money when trading in CFDs. You should consider whether you understand how CFD
כתב ויתור
המידע והפרסומים אינם מיועדים להיות, ואינם מהווים, ייעוץ או המלצה פיננסית, השקעתית, מסחרית או מכל סוג אחר המסופקת או מאושרת על ידי TradingView. קרא עוד ב־תנאי השימוש.
Global risk Warning CFDs are complex instruments and come with a high risk of losing money rapidly due to leverage. Between 74-89% of retail investor accounts lose money when trading in CFDs. You should consider whether you understand how CFD
כתב ויתור
המידע והפרסומים אינם מיועדים להיות, ואינם מהווים, ייעוץ או המלצה פיננסית, השקעתית, מסחרית או מכל סוג אחר המסופקת או מאושרת על ידי TradingView. קרא עוד ב־תנאי השימוש.