
Hi guys,
I saw a lot of fake guru comparing '16/'20 with todays'.
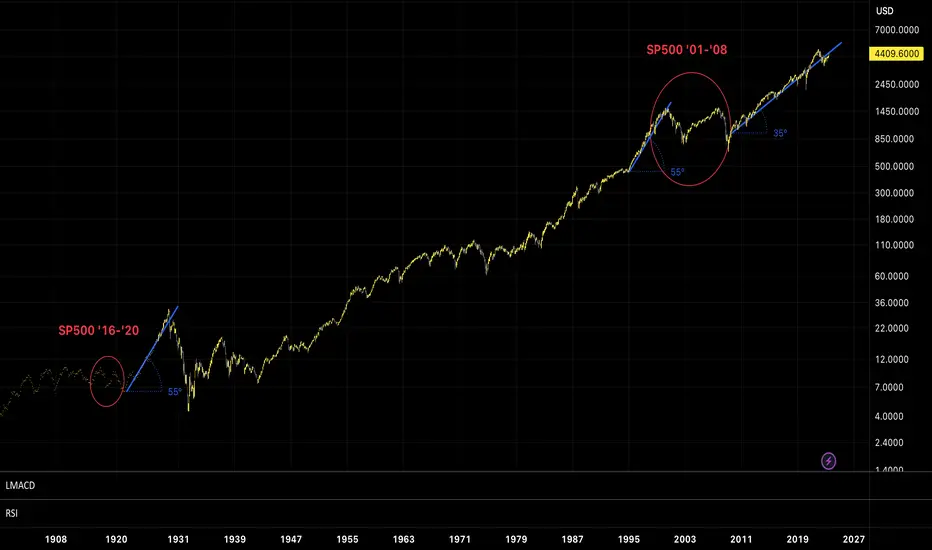
But in my mind is not true because if we compare '16/'20 with '01/'08 we all tend to agree the chart is so similar, but as u can see the rise after '08 crash is not in parabolic mode.
Could I'll be wrong? Of course, but if u find someone who compares chart randomly, unfollow immediately.
Let's see.
I saw a lot of fake guru comparing '16/'20 with todays'.
But in my mind is not true because if we compare '16/'20 with '01/'08 we all tend to agree the chart is so similar, but as u can see the rise after '08 crash is not in parabolic mode.
Could I'll be wrong? Of course, but if u find someone who compares chart randomly, unfollow immediately.
Let's see.

פרסומים קשורים
כתב ויתור
המידע והפרסומים אינם מיועדים להיות, ואינם מהווים, ייעוץ או המלצה פיננסית, השקעתית, מסחרית או מכל סוג אחר המסופקת או מאושרת על ידי TradingView. קרא עוד ב־תנאי השימוש.
פרסומים קשורים
כתב ויתור
המידע והפרסומים אינם מיועדים להיות, ואינם מהווים, ייעוץ או המלצה פיננסית, השקעתית, מסחרית או מכל סוג אחר המסופקת או מאושרת על ידי TradingView. קרא עוד ב־תנאי השימוש.