
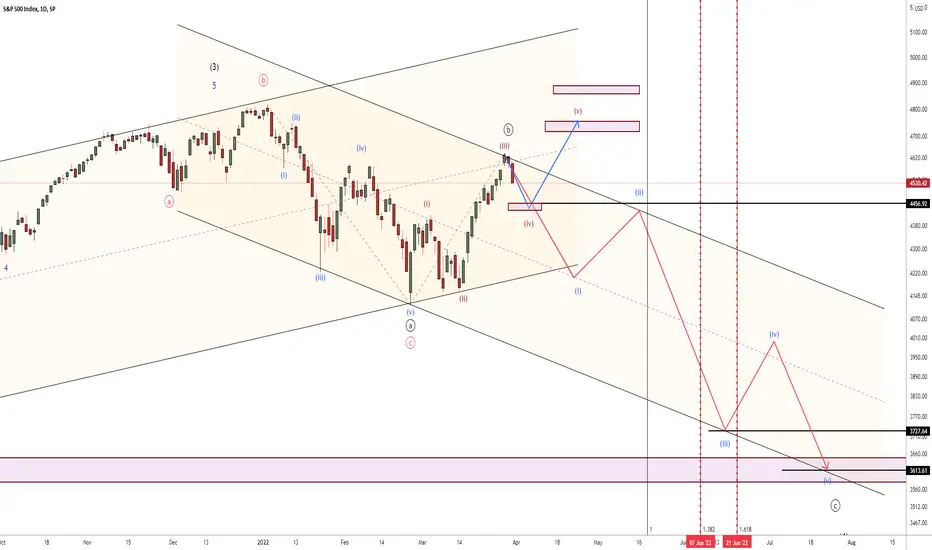
there are two scenarios in this chart.
1. if correction is over we follow Blueline
2. if we are in B wave then we follow Red line to 372 approx around mid-June
1. if correction is over we follow Blueline
2. if we are in B wave then we follow Red line to 372 approx around mid-June
עסקה סגורה: היעד הושג

כתב ויתור
המידע והפרסומים אינם מיועדים להיות, ואינם מהווים, ייעוץ או המלצה פיננסית, השקעתית, מסחרית או מכל סוג אחר המסופקת או מאושרת על ידי TradingView. קרא עוד ב־תנאי השימוש.
כתב ויתור
המידע והפרסומים אינם מיועדים להיות, ואינם מהווים, ייעוץ או המלצה פיננסית, השקעתית, מסחרית או מכל סוג אחר המסופקת או מאושרת על ידי TradingView. קרא עוד ב־תנאי השימוש.