S&P 500 Index ( SPX) 4H: Contracting Wedge Apex Drives Impulse Toward $7,550 Resistance Ceiling — Dual-Breakout Framework
### 🇺🇸 USA S&P 500 Index (SPX) 4-Hour Technical Matrix (Ref: SPX_2026-07-31_08-49-17.png)
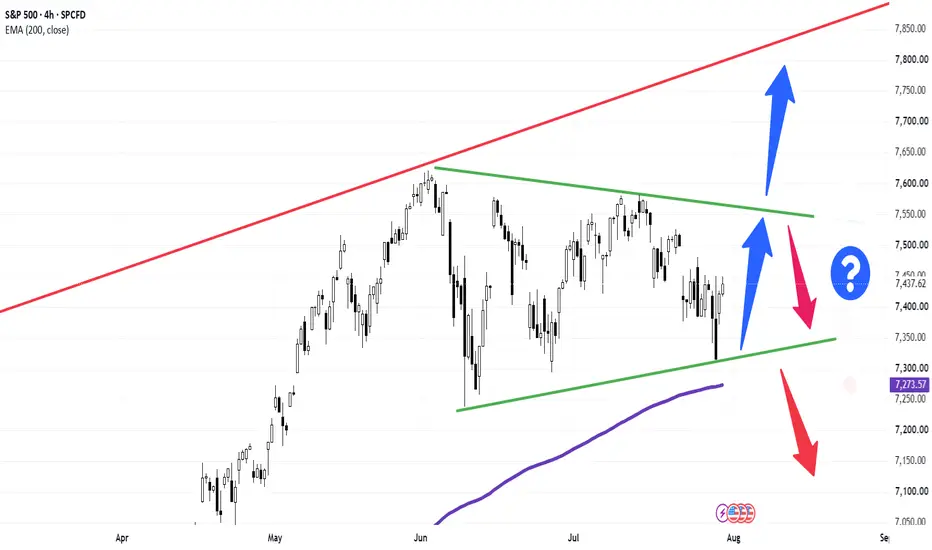
We are deploying a 4-Hour (4H) structural compression framework on the S&P 500 Index (SPX / US500). The benchmark index is currently navigating within a tight contracting wedge / symmetrical funnel geometry, springing off lower trendline support to initiate an internal leg toward the upper resistance boundary.
The index is trading with positive intraday momentum at **7,437.62 (+0.22%)**, advancing through the middle corridor of the pattern.
---
### 🔍 Technical Architecture & Funnel Mechanics:
Our quantitative framework isolates a critical decision apex defined by converging structural trendlines (green boundaries):
1. **Immediate Bullish Leg Within the Funnel (Blue Vector):** Price action is currently rebounding off the ascending support line (green LTA floor near **7,350.00**), driving an impulse leg aimed directly at testing the descending resistance trendline (green LTB ceiling around **7,550.00**).
2. **Breakout & Retest Confirmation Protocol:** As the apex tightens, the market will dictate its next macro direction based on candle closing strength outside the boundaries:
---
### 🛣️ Strategic Dual-Breakout Pathways:
* **Scenario A — Bullish Expansion to All-Time Highs (Blue Arrows):**
* **Mechanics:** A decisive 4-Hour candle close above **7,550.00** accompanied by expanding volume, followed by a successful throwback retest holding the green LTB as new support, confirms a bullish breakout. This unlocks an extended rally toward the upper macro trend channel ceiling (red resistance line) near **7,800.00 – 7,850.00**.
* **Scenario B — Rejection & Deeper Correction (Red Arrows):**
* **Mechanics:** Sell-side absorption at the **7,550.00** upper boundary will push price action back down toward the **7,350.00** support floor. A structural breakdown below this floor invalidates the wedge, triggering a deeper corrective phase toward the institutional **200-period EMA (purple line sitting at 7,273.57)** and secondary liquidity nodes near **7,150.00**.
### 📊 Tactical Parameters Summary:
* **Current Bias:** Neutral / Intraday Rebound Inside Funnel
* **Immediate Target Boundary (Wedge LTB):** ~7,550.00
* **Immediate Support Boundary (Wedge LTA):** ~7,350.00
* **Bullish Expansion Target (Red Line Ceiling):** 7,800.00 – 7,850.00
* **Institutional Risk Baseline (200-EMA):** 7,273.57
---
📊 **ChartPro Data**
*US Equity Architecture, Funnel Compression Mechanics & Systematic Risk Management.*
⚠️ **Disclaimer:** For educational and informational purposes only. This active market study represents a personal trading framework and does not constitute financial or investment advice.
SPX) 4H: Contracting Wedge Apex Drives Impulse Toward $7,550 Resistance Ceiling — Dual-Breakout Framework### 🇺🇸 USA S&P 500 Index (
SPX) 4-Hour Technical Matrix (Ref: SPX_2026-07-31_08-49-17.png)We are deploying a 4-Hour (4H) structural compression framework on the S&P 500 Index (
SPX / US500). The benchmark index is currently navigating within a tight contracting wedge / symmetrical funnel geometry, springing off lower trendline support to initiate an internal leg toward the upper resistance boundary.The index is trading with positive intraday momentum at **7,437.62 (+0.22%)**, advancing through the middle corridor of the pattern.
---
### 🔍 Technical Architecture & Funnel Mechanics:
Our quantitative framework isolates a critical decision apex defined by converging structural trendlines (green boundaries):
1. **Immediate Bullish Leg Within the Funnel (Blue Vector):** Price action is currently rebounding off the ascending support line (green LTA floor near **7,350.00**), driving an impulse leg aimed directly at testing the descending resistance trendline (green LTB ceiling around **7,550.00**).
2. **Breakout & Retest Confirmation Protocol:** As the apex tightens, the market will dictate its next macro direction based on candle closing strength outside the boundaries:
---
### 🛣️ Strategic Dual-Breakout Pathways:
* **Scenario A — Bullish Expansion to All-Time Highs (Blue Arrows):**
* **Mechanics:** A decisive 4-Hour candle close above **7,550.00** accompanied by expanding volume, followed by a successful throwback retest holding the green LTB as new support, confirms a bullish breakout. This unlocks an extended rally toward the upper macro trend channel ceiling (red resistance line) near **7,800.00 – 7,850.00**.
* **Scenario B — Rejection & Deeper Correction (Red Arrows):**
* **Mechanics:** Sell-side absorption at the **7,550.00** upper boundary will push price action back down toward the **7,350.00** support floor. A structural breakdown below this floor invalidates the wedge, triggering a deeper corrective phase toward the institutional **200-period EMA (purple line sitting at 7,273.57)** and secondary liquidity nodes near **7,150.00**.
### 📊 Tactical Parameters Summary:
* **Current Bias:** Neutral / Intraday Rebound Inside Funnel
* **Immediate Target Boundary (Wedge LTB):** ~7,550.00
* **Immediate Support Boundary (Wedge LTA):** ~7,350.00
* **Bullish Expansion Target (Red Line Ceiling):** 7,800.00 – 7,850.00
* **Institutional Risk Baseline (200-EMA):** 7,273.57
---
📊 **ChartPro Data**
*US Equity Architecture, Funnel Compression Mechanics & Systematic Risk Management.*
⚠️ **Disclaimer:** For educational and informational purposes only. This active market study represents a personal trading framework and does not constitute financial or investment advice.

כתב ויתור
המידע והפרסומים אינם מיועדים להיות, ואינם מהווים, ייעוץ או המלצה פיננסית, השקעתית, מסחרית או מכל סוג אחר המסופקת או מאושרת על ידי TradingView. קרא עוד ב־תנאי השימוש.
כתב ויתור
המידע והפרסומים אינם מיועדים להיות, ואינם מהווים, ייעוץ או המלצה פיננסית, השקעתית, מסחרית או מכל סוג אחר המסופקת או מאושרת על ידי TradingView. קרא עוד ב־תנאי השימוש.