
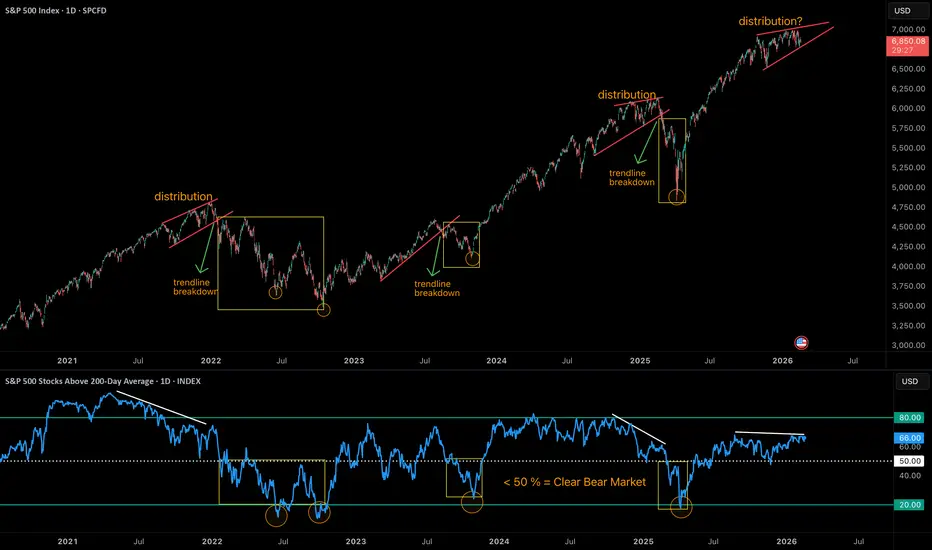
One of the cleanest ways to judge market health is by tracking the % of S&P 500 stocks trading above their 200-day moving average.
In a clear bull market, this number stays comfortably above 50%. Broad participation confirms strength.
Near major tops, we often see divergence — the index moves sideways or marginally higher while fewer stocks participate. Late-stage rallies get narrow. That’s where distribution begins.
However, distribution is only confirmed when price breaks a key trendline or loses a major moving average.
On the other side, extreme readings below 20% typically signal washed-out conditions where durable bottoms can form.
When breadth falls below 50%, it reflects bear market conditions at the index level.
Currently, breadth stands at 66%, while price is moving sideways.
This suggests either:
• A healthy consolidation within an uptrend
• Or early signs of distribution
A decisive trendline breakdown accompanied by breadth slipping below 50% would shift the structure toward a confirmed bear phase.
In a clear bull market, this number stays comfortably above 50%. Broad participation confirms strength.
Near major tops, we often see divergence — the index moves sideways or marginally higher while fewer stocks participate. Late-stage rallies get narrow. That’s where distribution begins.
However, distribution is only confirmed when price breaks a key trendline or loses a major moving average.
On the other side, extreme readings below 20% typically signal washed-out conditions where durable bottoms can form.
When breadth falls below 50%, it reflects bear market conditions at the index level.
Currently, breadth stands at 66%, while price is moving sideways.
This suggests either:
• A healthy consolidation within an uptrend
• Or early signs of distribution
A decisive trendline breakdown accompanied by breadth slipping below 50% would shift the structure toward a confirmed bear phase.

כתב ויתור
המידע והפרסומים אינם מיועדים להיות, ואינם מהווים, ייעוץ או המלצה פיננסית, השקעתית, מסחרית או מכל סוג אחר המסופקת או מאושרת על ידי TradingView. קרא עוד ב־תנאי השימוש.
כתב ויתור
המידע והפרסומים אינם מיועדים להיות, ואינם מהווים, ייעוץ או המלצה פיננסית, השקעתית, מסחרית או מכל סוג אחר המסופקת או מאושרת על ידי TradingView. קרא עוד ב־תנאי השימוש.