
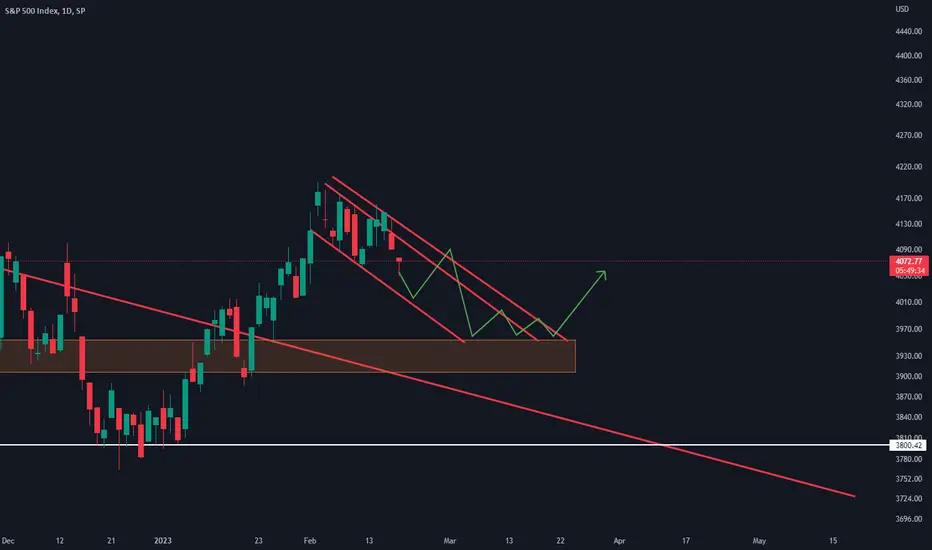
It looks like the SPX has topped out temporarily. This woudn't be too farfetched as the previous couple uptrends lasted for 34, 36, 21, 23, 40, and 33 days. Right now, we're looking at a top which has been formed after 28 days.
From the looks of it, its trying to form a falling channel. The properties of this pattern are:
- Declining parralel support and resistance lines
- Price oscilating between the support and resistance lines
- Bottom at an important support zone
- Going sideways after hitting the bottom, preferibly with a daily bullish divergence
I'm still bullish on the SPX for 2023, but for now i'm expecting a small correction.

כתב ויתור
המידע והפרסומים אינם מיועדים להיות, ואינם מהווים, ייעוץ או המלצה פיננסית, השקעתית, מסחרית או מכל סוג אחר המסופקת או מאושרת על ידי TradingView. קרא עוד ב־תנאי השימוש.
כתב ויתור
המידע והפרסומים אינם מיועדים להיות, ואינם מהווים, ייעוץ או המלצה פיננסית, השקעתית, מסחרית או מכל סוג אחר המסופקת או מאושרת על ידי TradingView. קרא עוד ב־תנאי השימוש.