
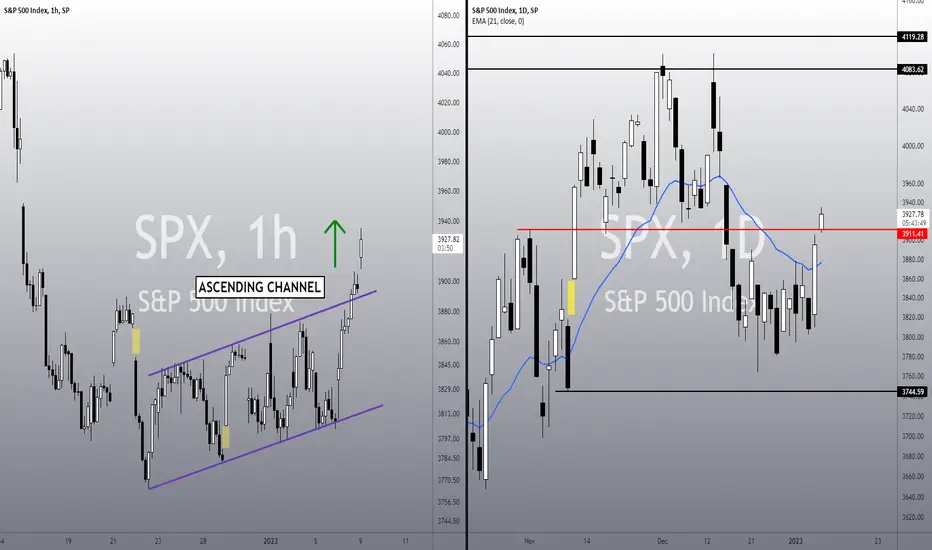
• The index is did exactly what we expected it would, since our previous analysis, last Friday (link below this post);
• It went up to hit the upper line of this Ascending Channel (in the 1h chart), but now, it seems we have a clear breakout;
• In the daily chart, it is trying to break our resistance at 3,911, and it broke the 21 EMA as well (which is starting to point up);
• All these signs point to a short/mid-term bullish reversal;
• So far, there’s no clear top sign, or any bearish structure around indicating a continuation of the bear trend;
• However, if the index loses the red line at 3,911 again, it might frustrate this attempt of a reversal, and it’ll resume the bear trend again;
• I’ll keep you updated on this every day, as usual, but for now, let’s pay attention to the 3,911.
Remember to follow me to keep in touch with my daily analyses!
• It went up to hit the upper line of this Ascending Channel (in the 1h chart), but now, it seems we have a clear breakout;
• In the daily chart, it is trying to break our resistance at 3,911, and it broke the 21 EMA as well (which is starting to point up);
• All these signs point to a short/mid-term bullish reversal;
• So far, there’s no clear top sign, or any bearish structure around indicating a continuation of the bear trend;
• However, if the index loses the red line at 3,911 again, it might frustrate this attempt of a reversal, and it’ll resume the bear trend again;
• I’ll keep you updated on this every day, as usual, but for now, let’s pay attention to the 3,911.
Remember to follow me to keep in touch with my daily analyses!

פרסומים קשורים
כתב ויתור
המידע והפרסומים אינם מיועדים להיות, ואינם מהווים, ייעוץ או המלצה פיננסית, השקעתית, מסחרית או מכל סוג אחר המסופקת או מאושרת על ידי TradingView. קרא עוד ב־תנאי השימוש.
כתב ויתור
המידע והפרסומים אינם מיועדים להיות, ואינם מהווים, ייעוץ או המלצה פיננסית, השקעתית, מסחרית או מכל סוג אחר המסופקת או מאושרת על ידי TradingView. קרא עוד ב־תנאי השימוש.