
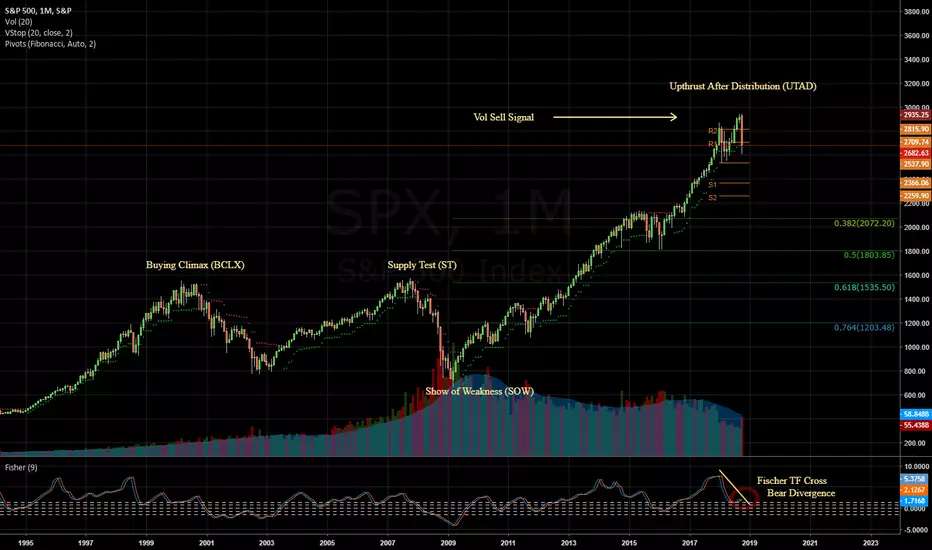
Everyone very focused on the the daily chart need to zoom out and look at weekly, similar to how traders look at the 15 min / 1hr / daily for swing trades. Monthly showing clear distribution on increasing volume. Vol sell signal triggered and would need a close above 2935 to be bullish. Vol stop signal has been extremely accurate on the monthly. Look at the green and red dots. Short the rally's until then.
I am long SPY Dec 2019 $150 puts at .65 avg px
I am long
SPY Dec 2019 $150 puts at .65 avg px
כתב ויתור
המידע והפרסומים אינם מיועדים להיות, ואינם מהווים, ייעוץ או המלצה פיננסית, השקעתית, מסחרית או מכל סוג אחר המסופקת או מאושרת על ידי TradingView. קרא עוד ב־תנאי השימוש.
כתב ויתור
המידע והפרסומים אינם מיועדים להיות, ואינם מהווים, ייעוץ או המלצה פיננסית, השקעתית, מסחרית או מכל סוג אחר המסופקת או מאושרת על ידי TradingView. קרא עוד ב־תנאי השימוש.