
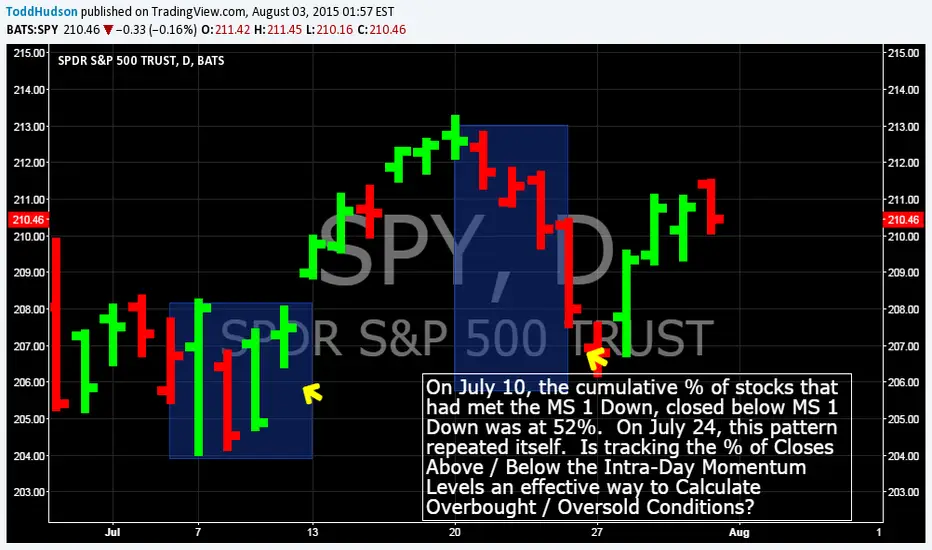
On July 10, the cumulative % of stocks that had met the MS 1 Down, closed below MS 1 Down was at 52%. On July 24, this pattern repeated itself. Is tracking the % of Closes Above / Below the Intra-Day Momentum Levels an effective way to Calculate Overbought / Oversold Conditions?

כתב ויתור
המידע והפרסומים אינם מיועדים להיות, ואינם מהווים, ייעוץ או המלצה פיננסית, השקעתית, מסחרית או מכל סוג אחר המסופקת או מאושרת על ידי TradingView. קרא עוד ב־תנאי השימוש.
כתב ויתור
המידע והפרסומים אינם מיועדים להיות, ואינם מהווים, ייעוץ או המלצה פיננסית, השקעתית, מסחרית או מכל סוג אחר המסופקת או מאושרת על ידי TradingView. קרא עוד ב־תנאי השימוש.