
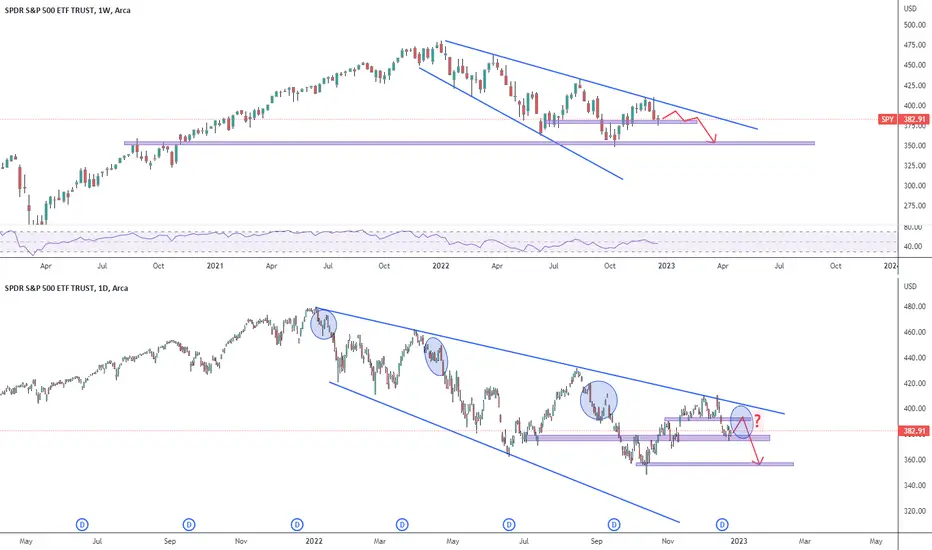
Top chart weekly timeframe, bottom chart daily timeframe. Price action on the top chart shows a Long Legged Doji candle at the $380 important support level. I think we will see a short term rally, retest the previous support now resistance $390 and then crash to the downside. I'm just waiting for the retest to open a short position.

כתב ויתור
המידע והפרסומים אינם מיועדים להיות, ואינם מהווים, ייעוץ או המלצה פיננסית, השקעתית, מסחרית או מכל סוג אחר המסופקת או מאושרת על ידי TradingView. קרא עוד ב־תנאי השימוש.
כתב ויתור
המידע והפרסומים אינם מיועדים להיות, ואינם מהווים, ייעוץ או המלצה פיננסית, השקעתית, מסחרית או מכל סוג אחר המסופקת או מאושרת על ידי TradingView. קרא עוד ב־תנאי השימוש.