
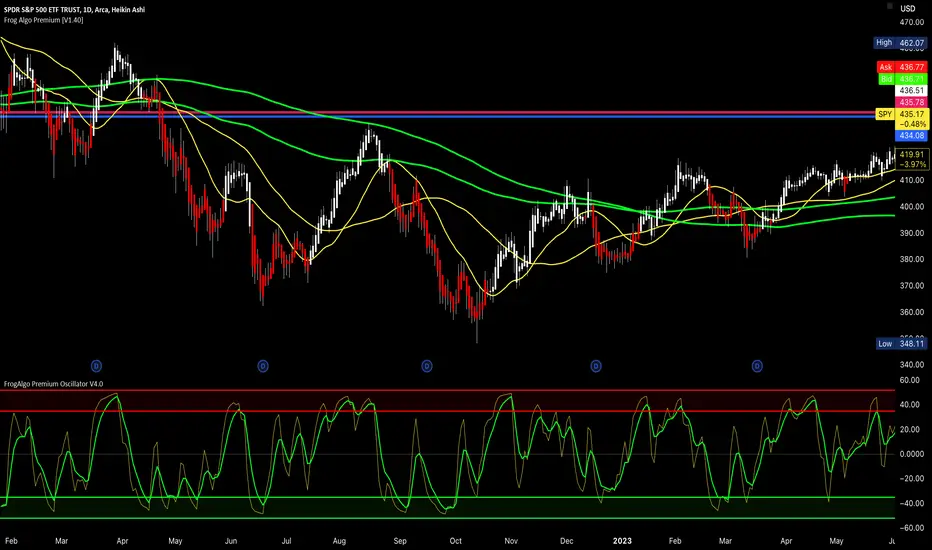
💥HOW TO TRADE:
Identifying Trends and Reversals 🎯
If you find this information helpful, please show your support with a LIKE ❤️.
Here's my approach to determining the intraday direction when trading short or long, specifically focusing on the relationship between Price and SMAs(20,50 and 200), EMA200, Oscillator, Support Line and Patterns:
🐸 Simple Moving Average 20, 50 and 200 & Exponential Moving Average200
🐸 Stochastic Oscillator: focus when oscillator in RedZone or GreenZone
🐸 Patterns: H Pattern, Inverted H Pattern
🐸 Support | Resistant Line
💥 One example of such confirmation reversal from bottom is: oscillator in callzone, H pattern (double bottoms), smas(20,50, and 200) & ema200 support, support line resistant.
💥 One example of such confirmation reversal from top is: oscillator in redzone, inverted H pattern (double tops), smas(20,50, and 200) & ema200 resistant, support line resistant.

Remember, trading involves risks, and it's important to have a well-defined strategy and risk management in place.
Identifying Trends and Reversals 🎯
If you find this information helpful, please show your support with a LIKE ❤️.
Here's my approach to determining the intraday direction when trading short or long, specifically focusing on the relationship between Price and SMAs(20,50 and 200), EMA200, Oscillator, Support Line and Patterns:
🐸 Simple Moving Average 20, 50 and 200 & Exponential Moving Average200
🐸 Stochastic Oscillator: focus when oscillator in RedZone or GreenZone
🐸 Patterns: H Pattern, Inverted H Pattern
🐸 Support | Resistant Line
💥 One example of such confirmation reversal from bottom is: oscillator in callzone, H pattern (double bottoms), smas(20,50, and 200) & ema200 support, support line resistant.
💥 One example of such confirmation reversal from top is: oscillator in redzone, inverted H pattern (double tops), smas(20,50, and 200) & ema200 resistant, support line resistant.
Remember, trading involves risks, and it's important to have a well-defined strategy and risk management in place.

Nothing
כתב ויתור
המידע והפרסומים אינם מיועדים להיות, ואינם מהווים, ייעוץ או המלצה פיננסית, השקעתית, מסחרית או מכל סוג אחר המסופקת או מאושרת על ידי TradingView. קרא עוד ב־תנאי השימוש.
Nothing
כתב ויתור
המידע והפרסומים אינם מיועדים להיות, ואינם מהווים, ייעוץ או המלצה פיננסית, השקעתית, מסחרית או מכל סוג אחר המסופקת או מאושרת על ידי TradingView. קרא עוד ב־תנאי השימוש.