
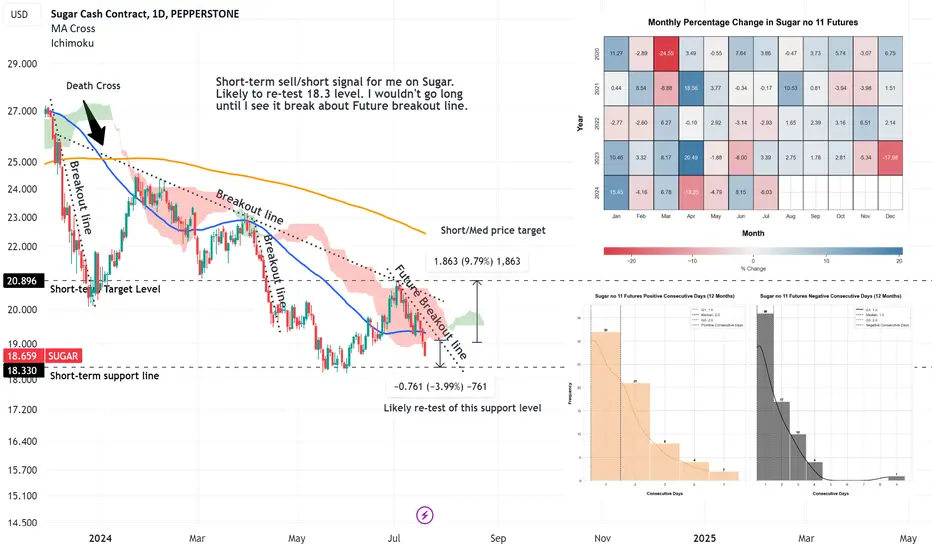
Short-term analysis of Sugar no11. Including 2 statistical charts showing the % monthly price changes over the last 5 years and a chart detailing the occurrence of consecutive positive and negative days "candles" and their frequency over 12 months.
- I expect more selling in July and then a rebound in August.
- Follow me on my socials for more detailed content
- I expect more selling in July and then a rebound in August.
- Follow me on my socials for more detailed content

כתב ויתור
המידע והפרסומים אינם מיועדים להיות, ואינם מהווים, ייעוץ או המלצה פיננסית, השקעתית, מסחרית או מכל סוג אחר המסופקת או מאושרת על ידי TradingView. קרא עוד ב־תנאי השימוש.
כתב ויתור
המידע והפרסומים אינם מיועדים להיות, ואינם מהווים, ייעוץ או המלצה פיננסית, השקעתית, מסחרית או מכל סוג אחר המסופקת או מאושרת על ידי TradingView. קרא עוד ב־תנאי השימוש.