
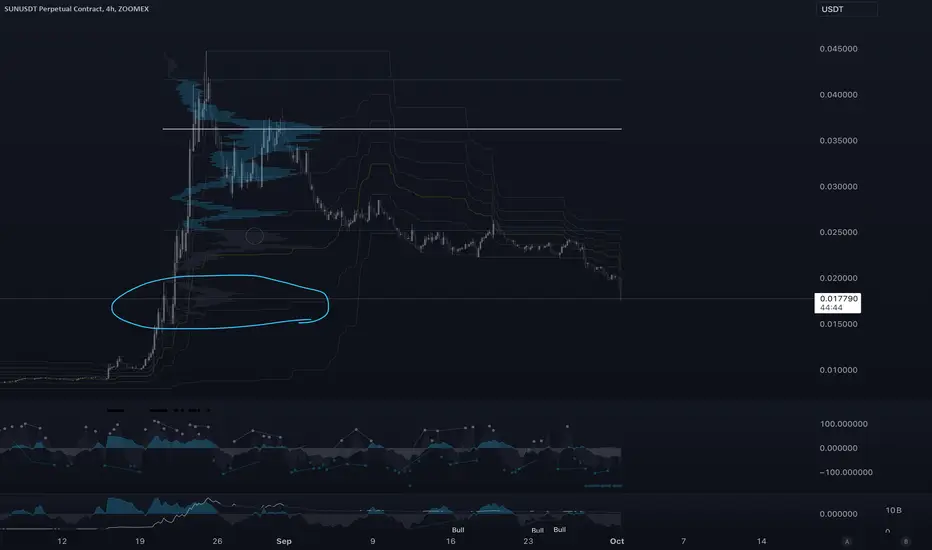
Ive created two fibonacci auto indicators. this one moves like an MA (moving average) line. So you can see and track how the fib levels have moved over time as the asset is traded. Its different from other moving averages. We have broken well below the value area low for the recent mountain climb. Now we look for support here. If it breaks we look for the next area below.
The area we are at now - using the volume profile - we can see a high volume node here and a smaller one below us. The point is these nodes show high traffic areas from past buying and selling. When you reach these areas on a chart its time to plan for support. It might not hold though. Thats why all good traders manage their risk with every trade.
Not Ever Financial Advice.
The area we are at now - using the volume profile - we can see a high volume node here and a smaller one below us. The point is these nodes show high traffic areas from past buying and selling. When you reach these areas on a chart its time to plan for support. It might not hold though. Thats why all good traders manage their risk with every trade.
Not Ever Financial Advice.
עסקה פעילה
lol the support is still holding today two years later
***Get 25% off Nami indicators - nami-trading.com/?dt_id=1375915
***CRYPTO TAXES use KOINLY - koinly.io/?via=97548A41&utm_source=affiliate
***JOIN TRADINGVIEW tradingview.com/?aff_id=137
***CRYPTO TAXES use KOINLY - koinly.io/?via=97548A41&utm_source=affiliate
***JOIN TRADINGVIEW tradingview.com/?aff_id=137
כתב ויתור
המידע והפרסומים אינם מיועדים להיות, ואינם מהווים, ייעוץ או המלצה פיננסית, השקעתית, מסחרית או מכל סוג אחר המסופקת או מאושרת על ידי TradingView. קרא עוד ב־תנאי השימוש.
***Get 25% off Nami indicators - nami-trading.com/?dt_id=1375915
***CRYPTO TAXES use KOINLY - koinly.io/?via=97548A41&utm_source=affiliate
***JOIN TRADINGVIEW tradingview.com/?aff_id=137
***CRYPTO TAXES use KOINLY - koinly.io/?via=97548A41&utm_source=affiliate
***JOIN TRADINGVIEW tradingview.com/?aff_id=137
כתב ויתור
המידע והפרסומים אינם מיועדים להיות, ואינם מהווים, ייעוץ או המלצה פיננסית, השקעתית, מסחרית או מכל סוג אחר המסופקת או מאושרת על ידי TradingView. קרא עוד ב־תנאי השימוש.