
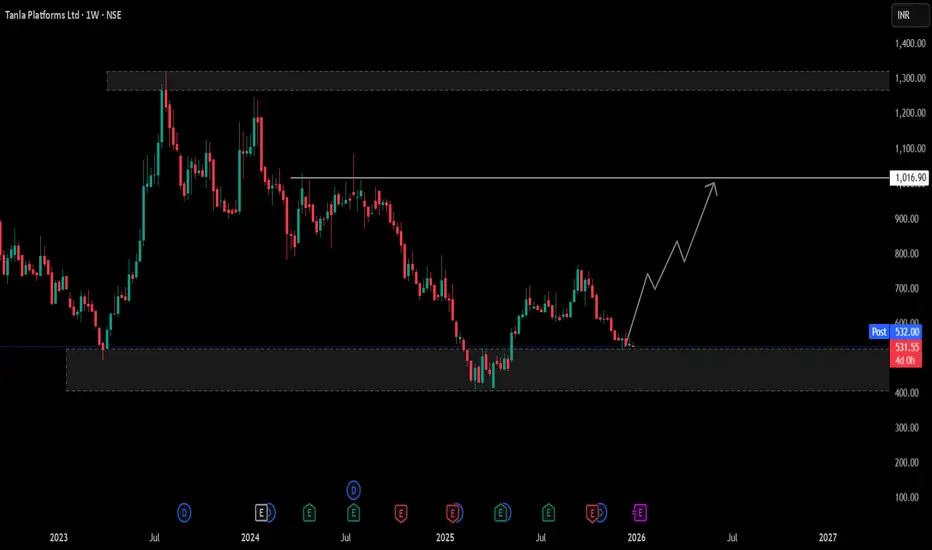
The stock is trading near a major demand zone around ₹500–520, where price has previously taken strong support. Current structure indicates a potential base formation with initial higher-low attempts visible. If the price sustains above this support zone, a relief rally toward the ₹800–900 zone is likely, with major resistance placed near ₹1,150–1,200, where multiple rejections occurred earlier. A breakdown below the support zone may invalidate the bullish structure.
Trend Bias: Accumulation to early reversal zone
Key Support: ₹500–520
Resistance Levels: ₹800–900 and ₹1,150–1,200
Disclaimer: This is a technical analysis view for educational purposes only, not investment or trading advice. Market conditions may change, so please do your own research or consult a financial advisor before making any decisions.
Trend Bias: Accumulation to early reversal zone
Key Support: ₹500–520
Resistance Levels: ₹800–900 and ₹1,150–1,200
Disclaimer: This is a technical analysis view for educational purposes only, not investment or trading advice. Market conditions may change, so please do your own research or consult a financial advisor before making any decisions.

כתב ויתור
המידע והפרסומים אינם מיועדים להיות, ואינם מהווים, ייעוץ או המלצה פיננסית, השקעתית, מסחרית או מכל סוג אחר המסופקת או מאושרת על ידי TradingView. קרא עוד ב־תנאי השימוש.
כתב ויתור
המידע והפרסומים אינם מיועדים להיות, ואינם מהווים, ייעוץ או המלצה פיננסית, השקעתית, מסחרית או מכל סוג אחר המסופקת או מאושרת על ידי TradingView. קרא עוד ב־תנאי השימוש.