
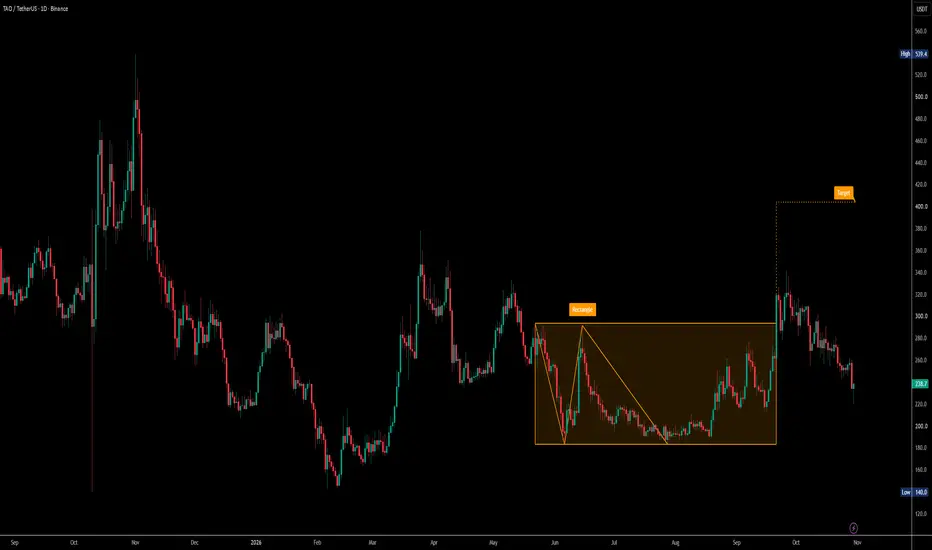
TAOUSDT | 1D Timeframe | Binance
TAOUSDT is trading near $238.30, showing a corrective movement following a breakout from a multi-month rectangle consolidation pattern.
The daily chart highlights a rectangle formation between approximately $185 and $293, extending from late May through September.
Price previously broke above the upper boundary near $293, rallied toward $340, and subsequently entered a correction.
The current decline has taken price back inside the former consolidation range, suggesting that the earlier bullish breakout has lost momentum.
Key Resistance Levels:
- $260–$280 – Immediate resistance region
- $290–$295 – Rectangle breakout boundary
- $320–$340 – Previous rally resistance
Key Support Levels:
- $230–$240 – Immediate support region
- $200–$210 – Intermediate support
- $180–$190 – Rectangle lower boundary
Bullish Scenario:
A sustained daily close above $293–$295 could indicate a recovery above the rectangle resistance.
If confirmed, price could revisit $320–$340, with the chart's projected upside target near $405.
The projected move from the $293 breakout level to $405 represents approximately 38.2% upside.
Bearish Scenario:
Failure to hold $230 could expose the $200–$210 region.
A sustained breakdown below $180–$190 would weaken the rectangle's longer-term support structure and invalidate the proposed bullish continuation scenario.
Confirmation Level:
A daily close above $295, preferably followed by a successful retest of that level as support, would provide stronger evidence for the bullish setup.
Conclusion:
TAOUSDT previously broke above its multi-month rectangle consolidation but has since fallen back into the range.
The $293–$295 resistance zone remains the primary bullish confirmation level, while $230 is the immediate support to monitor.
Watch for confirmation before interpreting the projected $405 target as an active bullish continuation.
TAOUSDT is trading near $238.30, showing a corrective movement following a breakout from a multi-month rectangle consolidation pattern.
The daily chart highlights a rectangle formation between approximately $185 and $293, extending from late May through September.
Price previously broke above the upper boundary near $293, rallied toward $340, and subsequently entered a correction.
The current decline has taken price back inside the former consolidation range, suggesting that the earlier bullish breakout has lost momentum.
Key Resistance Levels:
- $260–$280 – Immediate resistance region
- $290–$295 – Rectangle breakout boundary
- $320–$340 – Previous rally resistance
Key Support Levels:
- $230–$240 – Immediate support region
- $200–$210 – Intermediate support
- $180–$190 – Rectangle lower boundary
Bullish Scenario:
A sustained daily close above $293–$295 could indicate a recovery above the rectangle resistance.
If confirmed, price could revisit $320–$340, with the chart's projected upside target near $405.
The projected move from the $293 breakout level to $405 represents approximately 38.2% upside.
Bearish Scenario:
Failure to hold $230 could expose the $200–$210 region.
A sustained breakdown below $180–$190 would weaken the rectangle's longer-term support structure and invalidate the proposed bullish continuation scenario.
Confirmation Level:
A daily close above $295, preferably followed by a successful retest of that level as support, would provide stronger evidence for the bullish setup.
Conclusion:
TAOUSDT previously broke above its multi-month rectangle consolidation but has since fallen back into the range.
The $293–$295 resistance zone remains the primary bullish confirmation level, while $230 is the immediate support to monitor.
Watch for confirmation before interpreting the projected $405 target as an active bullish continuation.

Twitter: x.com/crypto_vulture1
📊 TA & strategies
Telegram: t.me/crypto_vulture_signals
📊 TA & strategies
Telegram: t.me/crypto_vulture_signals
כתב ויתור
המידע והפרסומים אינם מיועדים להיות, ואינם מהווים, ייעוץ או המלצה פיננסית, השקעתית, מסחרית או מכל סוג אחר המסופקת או מאושרת על ידי TradingView. קרא עוד ב־תנאי השימוש.
Twitter: x.com/crypto_vulture1
📊 TA & strategies
Telegram: t.me/crypto_vulture_signals
📊 TA & strategies
Telegram: t.me/crypto_vulture_signals
כתב ויתור
המידע והפרסומים אינם מיועדים להיות, ואינם מהווים, ייעוץ או המלצה פיננסית, השקעתית, מסחרית או מכל סוג אחר המסופקת או מאושרת על ידי TradingView. קרא עוד ב־תנאי השימוש.