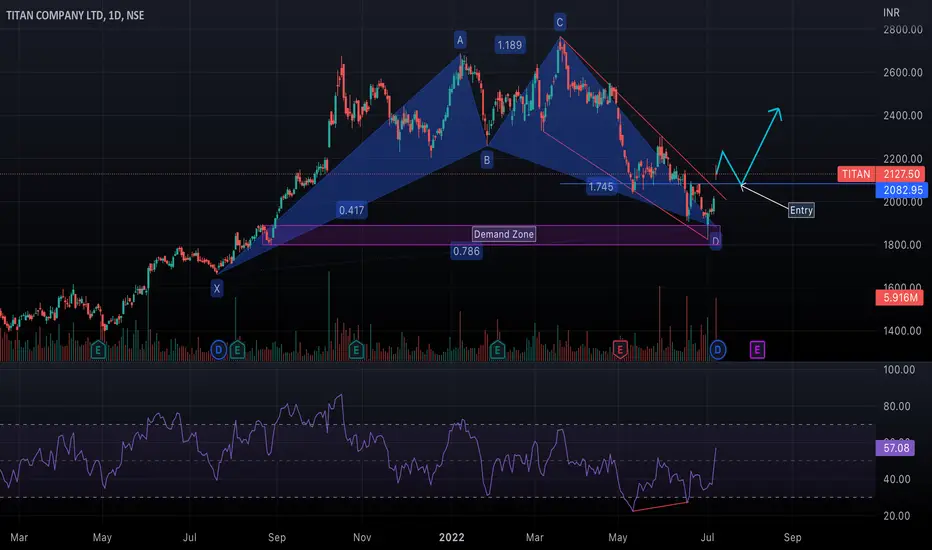
Let's understand multi timeframe analysis for  TITAN.
Weekly TF -
TITAN has been trading in a falling wedge pattern (LH-LL) and has recently re-tested a major demand zone. A bullish engulfing candlestick has been formed. There's an additional confluence of Harmonic Cypher PRZ around 1880.

Daily TF -
Bullish RSI divergence has been seen on daily TF. Price gaped up and did a breakout from a falling wedge structure. Short term bullish entry can be taken if price retraces back to 2080 level which was acting as a resistance earlier.

TITAN.Weekly TF -
TITAN has been trading in a falling wedge pattern (LH-LL) and has recently re-tested a major demand zone. A bullish engulfing candlestick has been formed. There's an additional confluence of Harmonic Cypher PRZ around 1880.Daily TF -
Bullish RSI divergence has been seen on daily TF. Price gaped up and did a breakout from a falling wedge structure. Short term bullish entry can be taken if price retraces back to 2080 level which was acting as a resistance earlier.
הערה
Price reversed as per the analysis and moved higher.
כתב ויתור
המידע והפרסומים אינם מיועדים להיות, ואינם מהווים, ייעוץ או המלצה פיננסית, השקעתית, מסחרית או מכל סוג אחר המסופקת או מאושרת על ידי TradingView. קרא עוד ב־תנאי השימוש.
כתב ויתור
המידע והפרסומים אינם מיועדים להיות, ואינם מהווים, ייעוץ או המלצה פיננסית, השקעתית, מסחרית או מכל סוג אחר המסופקת או מאושרת על ידי TradingView. קרא עוד ב־תנאי השימוש.